|

Novo Nordisk (NVO) should remain supported and resume rally

Novo Nordisk A/S (NVO), a healthcare company engages in the research, development, manufacture and marketing of the pharmaceutical products worldwide. It operates in two segments, Diabetes & Obesity care & Biopharm. It is based in Denmark, comes under Healthcare – Biotechnology sector & trades as “NVO” ticker at NYSE.

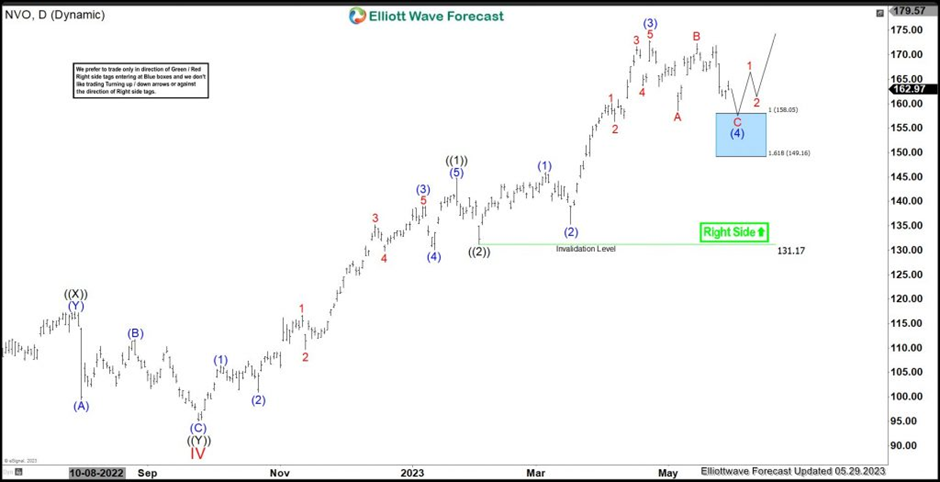
As showing in the previous article, NVO favors higher in V of (I) & expect further upside. Above ((2)) low of $131.17, It favors pullback in (4) in flat correction before final push higher in (5) to finish ((3)) of V.

NVO – Elliott Wave view from 2.18.2023

Chart

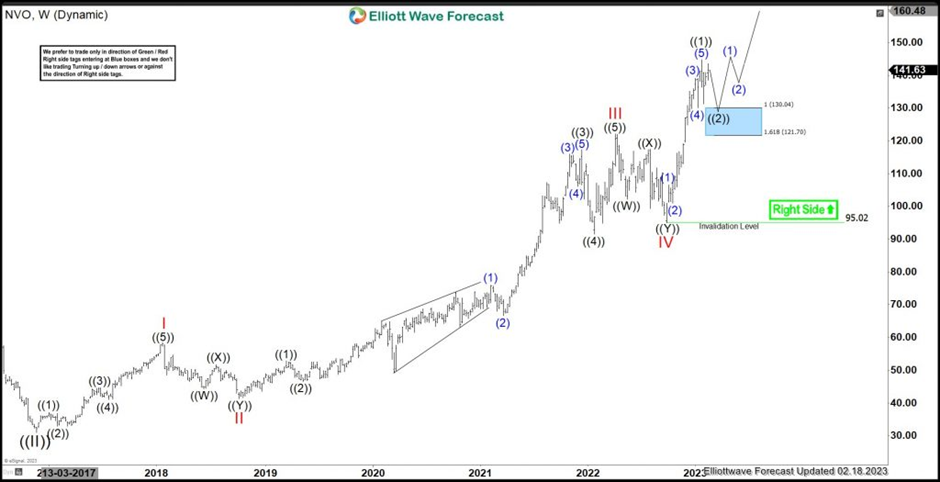
It placed wave ((II)) at $30.89 low in 2016 & favors higher in (I) as impulse sequence in ((III)). It placed wave I at $58.37 high & II at $41.23 low as 0.618 Fibonacci retracement. Above there, it extended higher in third wave extension, which ended as III at $122.16 high. It finished IV at $95.02 low as double correction slightly above 0.382 Fibonacci retracement of III. It favors higher in V of (I) & expect further upside.

NVO – Elliott Wave latest weekly view

Chart

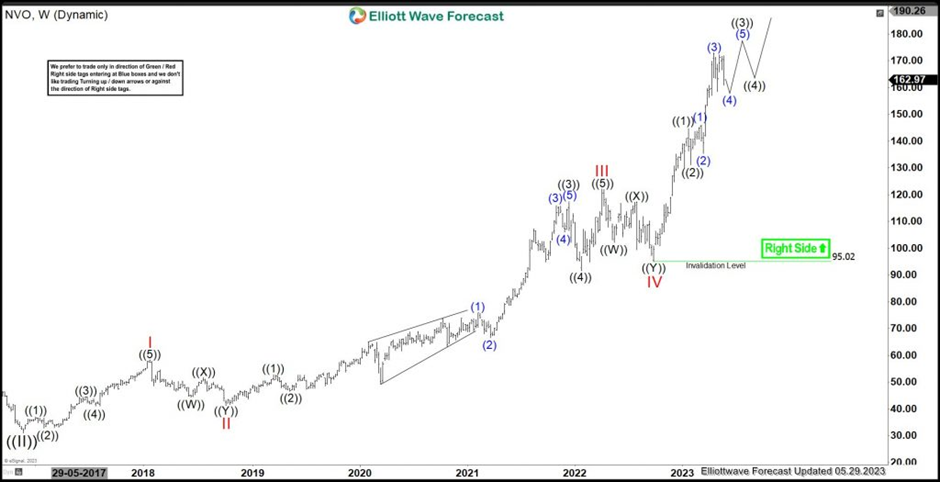
In wave V, it placed ((1)) at $144.78 high & ((2)) at $131.17 low as shallow correction. Above ((2)) low, it placed (1) at $145.94 high, (2) at $135.32 low & (3) at 172.97 high. It favors pullback in (4) in 3 swing correction, which expect to pullback towards $158.05 – $149.16 area before final push higher resumes in (5) to finish ((3)) of V. In Short term, it may even ended (4) at $158.51 low & favors higher in (5) as alternate view, which confirms above (3) high, without breaking lower. It expects two or few more highs to finish V of (I), while momentum divergence remains intact in weekly sequence. Alternatively, if it erases the momentum divergence, then it will be the part of III sequence in (I).

NVO – Elliott Wave latest daily view

Chart

Author

Elliott Wave Forecast Team

Elliott Wave Forecast Team

ElliottWave-Forecast.com

More from Elliott Wave Forecast Team
Share:

Editor's Picks

EUR/USD deflates to fresh lows, targets 1.1600

The selling pressure on EUR/USD now gathers extra pace, prompting the pair to hit fresh multi-week lows in the 1.1625-1.1620 band on Friday. The continuation of the downward bias comes in response to further gains in the US Dollar as market participants continue to assess the mixed release of US Nonfarm Payrolls in December.

GBP/USD breaks below 1.3400, challenges the 200-day SMA

GBP/USD remains under heavy fire and retreats for the fourth consecutive day on Friday. Indeed, Cable suffers the strong performance of the Greenback, intensified post-mixed NFP, and trades at shouting distance from its critical 200-day SMA near 1.3380.

Gold flirts with yearly tops around $4,500

Gold keeps its positive bias on Friday, adding to Thursday’s advance and challenging yearly highs in the $4,500 region per troy ounce. The risk-off sentiment favours the yellow metal despite the firmer tone in the Greenback and rising US Treasury yields.

Crypto Today: Bitcoin, Ethereum, XRP risk further decline as market fear persists amid slowing demand

Bitcoin holds $90,000 but stays below the 50-day EMA as institutional demand wanes. Ethereum steadies above $3,000 but remains structurally weak due to ETF outflows. XRP ETFs resume inflows, but the price struggles to gain ground above key support.

Week ahead – US CPI might challenge the geopolitics-boosted Dollar

Geopolitics may try to steal the limelight from US data. A possible US Supreme Court ruling on tariffs could dictate market movements. A crammed data calendar next week, US CPI comes on Tuesday; Fedspeak to intensify.

XRP trades under pressure amid weak retail demand

XRP presses down on the 50-day EMA support as risk-averse sentiment spreads despite a positive start to 2026. XRP faces declining retail demand, as reflected in futures Open Interest, which has fallen to $4.15 billion.