Mullen Automotive Stock Forecast: MULN needs to hold $0.10 support
- MULN is down 2.5% in Friday's premarket.
- Lucid Group missed projections for production in Q1.
- Lucid deliveries were 27% below Q4.
- EPA release an agressive new proposal to increase EV adoption.

Mullen Automotive (MULN) fell 2.5% in Friday's premarket after luxury EV maker Lucid Group (LCID) missed expectations for both production and deliveries in the first quarter. MULN stock is trading down at $0.1014 in the premarket.
Mullen stock news
Late on Thursday, Lucid Group (LCID) announced production and deliveries for the first quarter that were far and away worse than what Wall Street had predicted. The maker of luxury EVs "produced 2,314 vehicles in the first quarter and delivered 1,406. Those figures were a far cry from the previous quarter's figures of 3,493 vehicles produced and 1,932 delivered between October and December of 2022. Sequentially, that amounts to a 34% pullback for production and a 27% decline for deliveries QoQ."
While many are blaming Tesla (TSLA) for its agressive price cuts in the first quarter, it seems that even production is remaining a weak point for Lucid. As Lucid has a market cap about 60 times larger than Mullen, that negativity is hitting all other EV manufacturers below it on Friday.
The US Environmental Protection Agency (EPA) posted new emissions standards earlier this week that are expected to buffer electric vehicles over the next 10 years. The EPA said its policy would help cut 10 billion tons of CO2 emissions from internal combustion engine vehicles over that time period while saving consumers billion of US Dollars in gasoline expense. The policy is expected to push new purchases of light-utility vehicles to 67% of all US sales in 2032.
Earlier this month Mullen introduced its new polymer solid-state batteries for its Mullen Class 1 EV cargo van that it says will push range from 110 miles to over 200 in the near future.
Mullen stock forecast
Mullen stock has been moving sideways around 10 cents for the past few weeks, although its cargo van supply agreement with Randy Marion commercial dealership led to a brief rally. Since March 23, MULN stock has been in a bullish crossover pattern on the Moving Average Convergence Divergence (MACD) indicator. For now MULN needs to hold 10 cents in order to keep interest alive. If this support breaks, expect lots of investors to sell out of their positions.
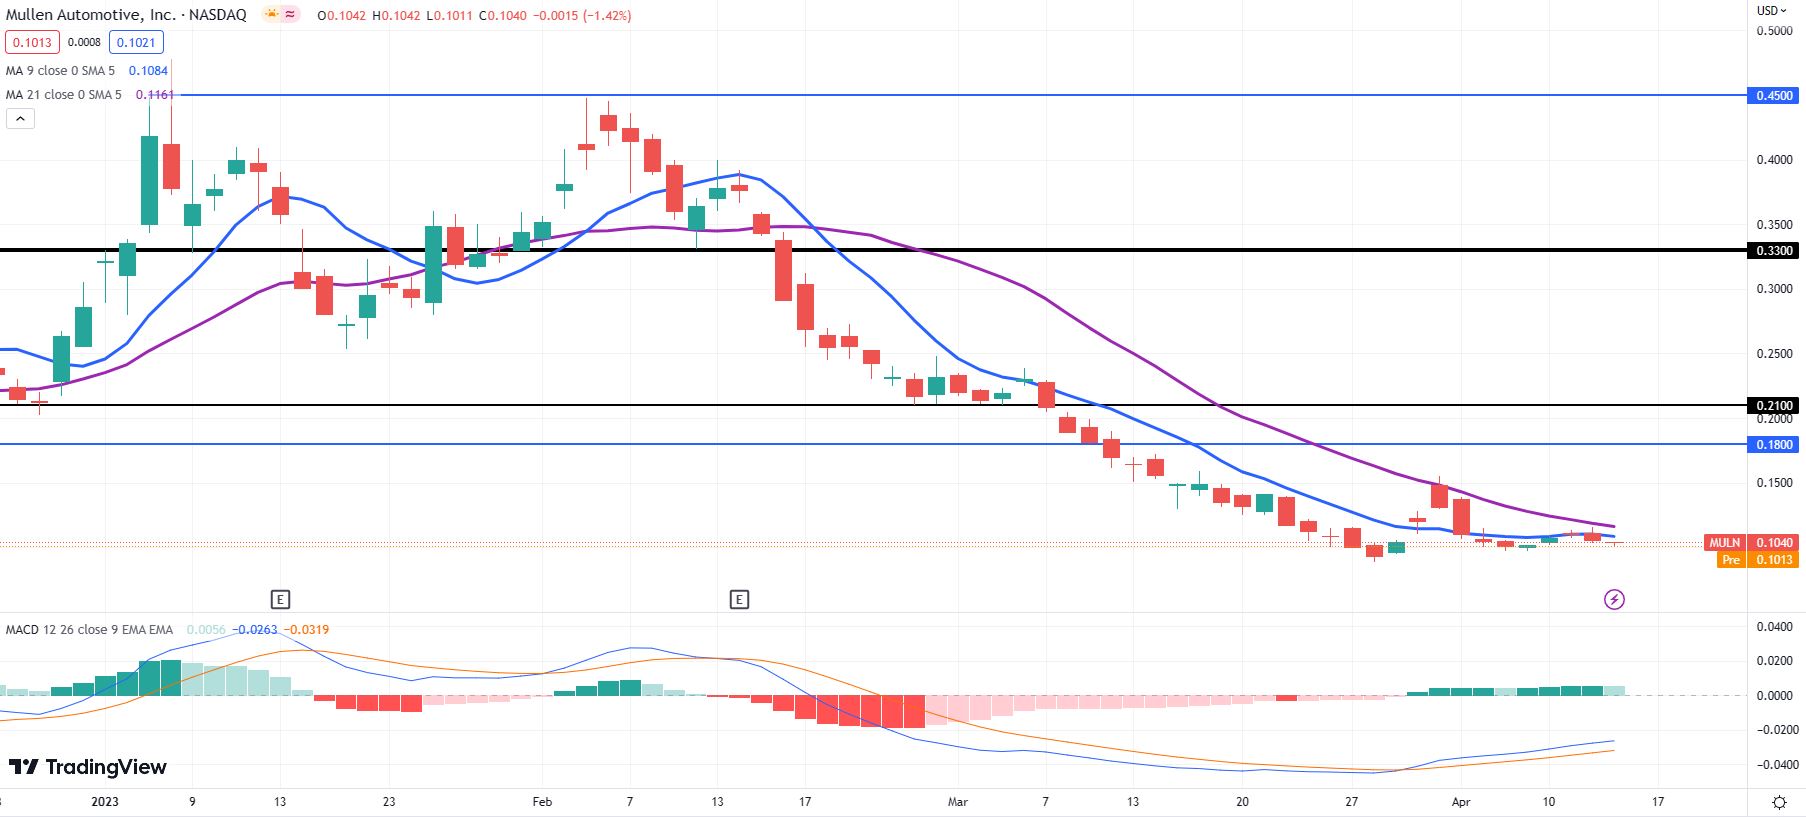
MULN daily chart
Premium
You have reached your limit of 3 free articles for this month.
Start your subscription and get access to all our original articles.
Author

Clay Webster
FXStreet
Clay Webster grew up in the US outside Buffalo, New York and Lancaster, Pennsylvania. He began investing after college following the 2008 financial crisis.


