Microsoft (MSFT Stock) Elliott Wave: Calling the decline after flat

In this technical article we’re going to take a look at the Elliott Wave charts of Microsoft $MSFT stock published in members area of the website. As our members know $MSFT has recently given us Irregular flat pattern against the 294.26 peak. Once the stock completed flat correction, it made decline toward new lows as expected. Now $MSFT is showing lower low sequences in the cycle from the 294.26 high, which are calling for a further weakness.
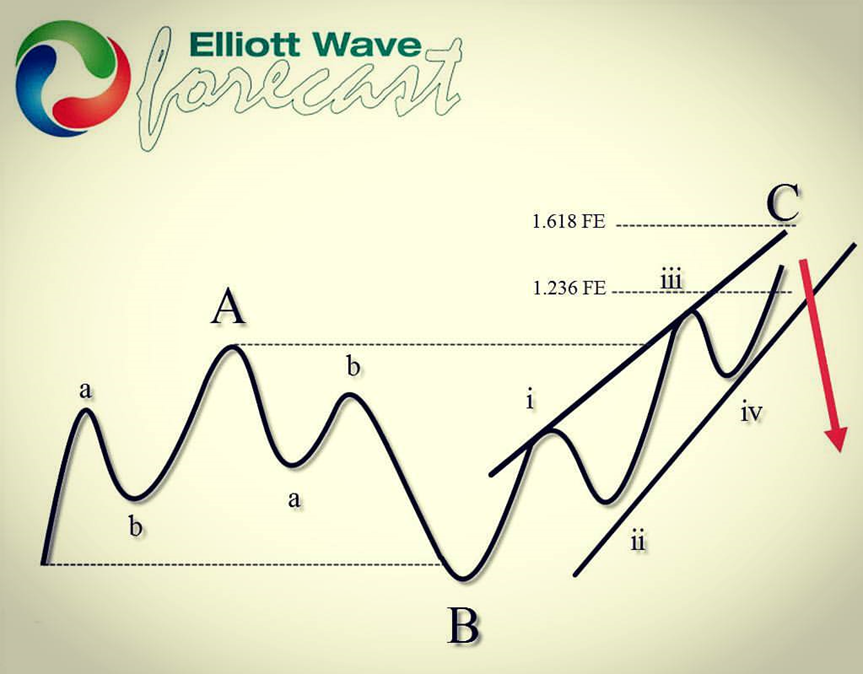
Before we take a look at the real market example of Expanded Flat, let’s explain the pattern in a few words.
Elliott Wave expanded flat theory
Elliott Wave Flat is a 3 wave corrective pattern which could often be seen in the market nowadays. Inner subdivision is labeled as A,B,C , with inner 3,3,5 structure. Waves A and B have forms of corrective structures like zigzag, flat, double three or triple three. Third wave C is always 5 waves structure, either motive impulse or ending diagonal pattern. It’s important to notice that in Irregular Flat Pattern wave B completes below the starting point of wave A. Wave C ends above the ending point of wave A . Wave C of Flat completes usually between 1.00 to 1.236 Fibonacci extension of A related to B, but sometimes it could go up to 1.618 fibs ext.
At the graphic below, we can see what an Expanded Flat structure looks like.
Now, let’s take a look what Elliott Wave Flat Pattern looks like in the real market
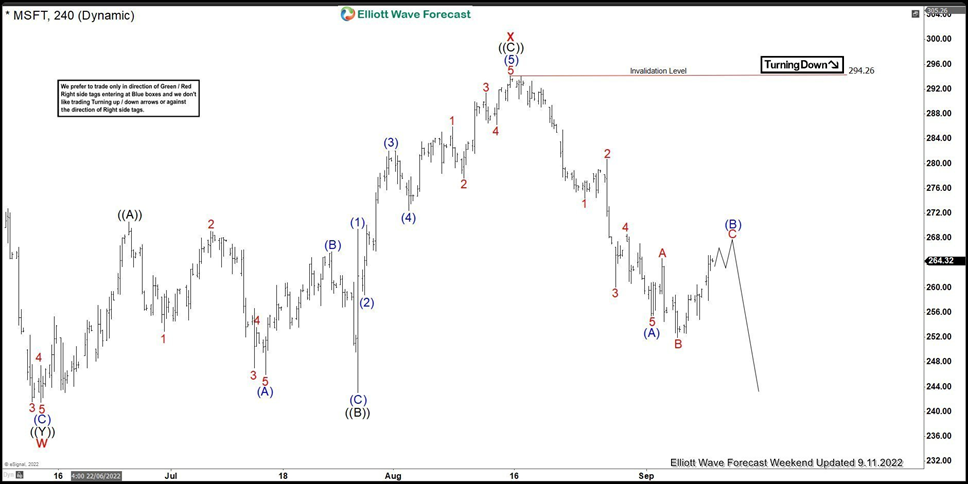
Microsoft ($MSFT) 4h Elliott Wave a09.11.2022.
The stock has made 5 waves down from the 294.26 peak and now correcting that cycle. Current view suggests that $MSFT is giving us recovery against the 294.26 peak that is unfolding as Irregular Flat Pattern. When we downgrade charts to lower time frames , we can see waves inner subdivisions of A and B red are having corrective sequences. Wave B has broken the starting point of A while C has broken ending point of A which is characteristic of Irregular flat. Wave C red leg should complete as 5 waves soon. We expect (B) blue recovery to complete around 264.2-267.8 area as Flat structure.
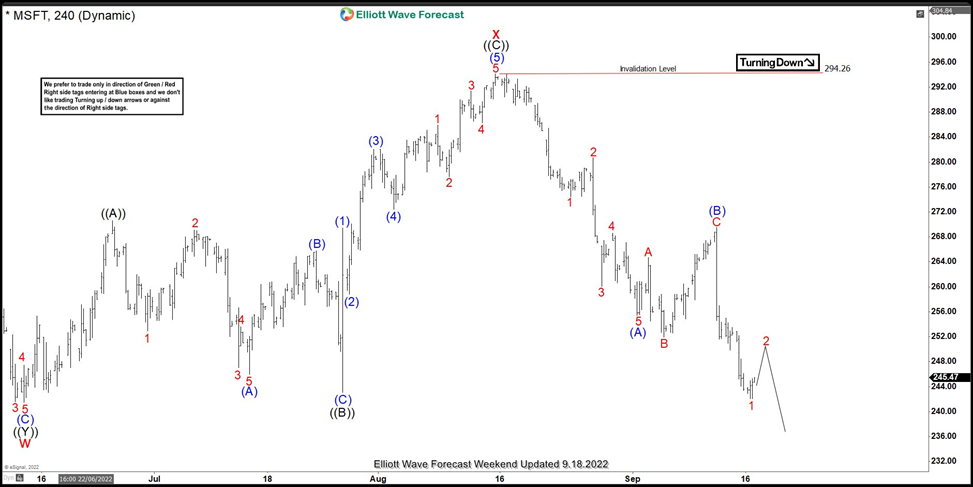
Microsoft ($MSFT) 4h Elliott Wave analysis 09.18.2022
Microsoft stock ended (B) blue recovery at 267.39 high and made turn lower as we expected. Eventually the price has broken previous low (A) blue which was important confirmation that bears are taking control. Further weakness is expected in the stock as far as pivot at (B) blue peak( 267.39) holds. Short term cycle from that high completed as 5 waves- leading diagonal. It is labeled as 1 red which is first leg of wave (C) blue. We expect bounce in 3 waves in 2 red, before further drop takes place.
Author

Elliott Wave Forecast Team
ElliottWave-Forecast.com


