GBP/JPY Price Forecast: Slides as risk-off surge boosts the Yen
- GBP/JPY slides as risk aversion boosts Yen demand; equities fall on AI disruption fears.
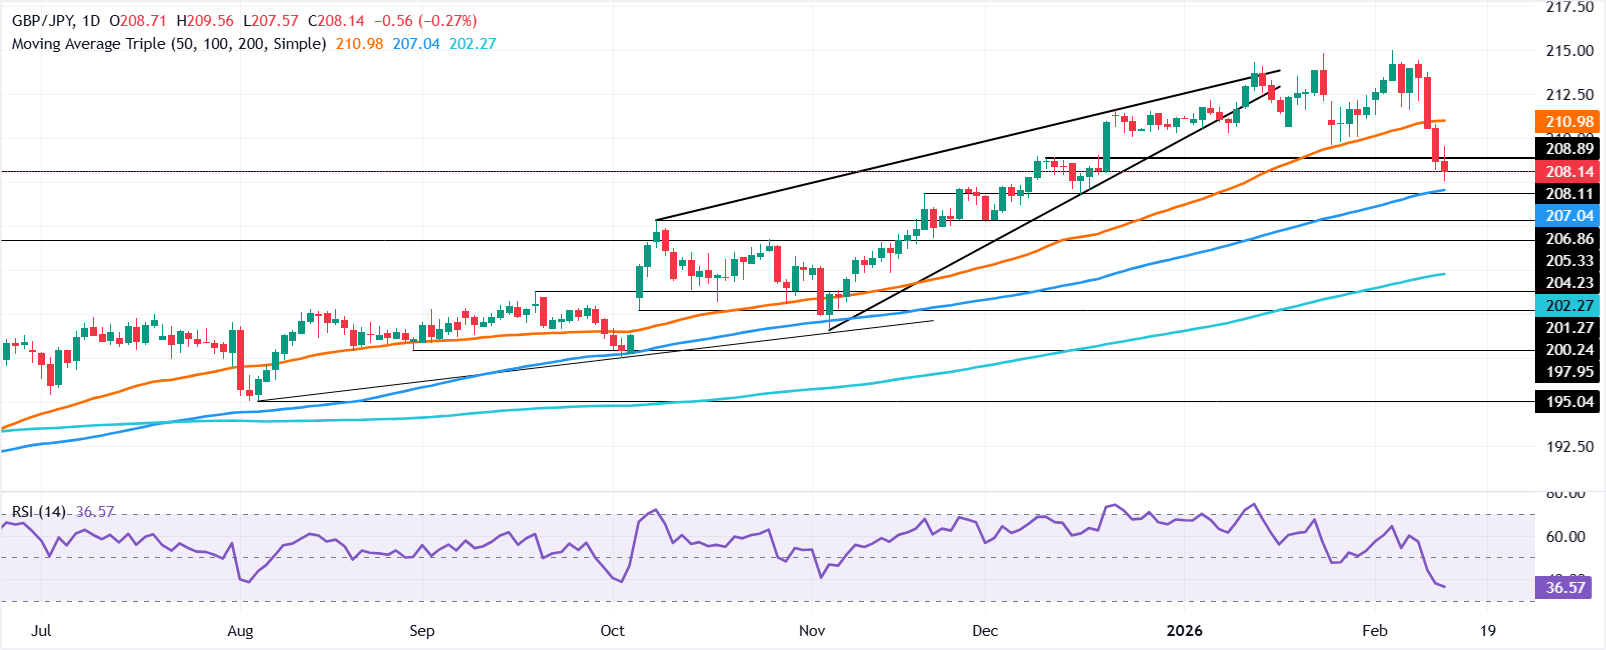
- Break below 50-day SMA turns bias neutral; RSI signals emerging bearish momentum.
- Drop under 207.00 may expose deeper support at 206.80 and 205.20.

The Pound Sterling tumbles on Thursday, down 0.36% in the day as risk aversion boosted the safe-haven appeal of the Japanese Yen. Renewed AI disruption fears sent Wall Street plunging, while haven assets like Gold, Silver and the US Dollar failed to gain traction. At the time of writing, the GBP/JPY trades at 209.09 after hitting a daily high fo 209.55.
GBP/JPY Price Forecast: Technical outlook
The overall trend is up, yet after the cross breached the 50-day SMA at 210.87, it shifted to neutral-bullish with the first support level emerging at a support trendline around the 207.00-207.20 area.
Momentum shifted bearish as depicted by the Relative Strength Index (RSI). Hence further downside is seen in the short term.
If GBP/JPY tumbles below 207.00, the next support would be the 100-day SMA at 206.85 ahead of the December 16 swing low 0f 206.77. On further weakness, the next demand area would be the December 1 low at 205.20.
Conversely, if GBP/JPY rises past 208.50, the 209.00 mark emerges as the first resistance. Overhead lies the February 12 daily high at 209.55, ahead of the 210.00 milestone.
GBP/JPY Price Chart – Daily
Japanese Yen Price This week
The table below shows the percentage change of Japanese Yen (JPY) against listed major currencies this week. Japanese Yen was the strongest against the US Dollar.
| USD | EUR | GBP | JPY | CAD | AUD | NZD | CHF | |
|---|---|---|---|---|---|---|---|---|
| USD | -0.46% | -0.26% | -3.05% | -0.42% | -1.14% | -0.33% | -1.00% | |
| EUR | 0.46% | 0.20% | -2.66% | 0.05% | -0.68% | 0.13% | -0.57% | |
| GBP | 0.26% | -0.20% | -2.54% | -0.15% | -0.87% | -0.07% | -0.73% | |
| JPY | 3.05% | 2.66% | 2.54% | 2.77% | 2.00% | 2.85% | 2.06% | |
| CAD | 0.42% | -0.05% | 0.15% | -2.77% | -0.62% | 0.10% | -0.58% | |
| AUD | 1.14% | 0.68% | 0.87% | -2.00% | 0.62% | 0.81% | 0.11% | |
| NZD | 0.33% | -0.13% | 0.07% | -2.85% | -0.10% | -0.81% | -0.67% | |
| CHF | 1.00% | 0.57% | 0.73% | -2.06% | 0.58% | -0.11% | 0.67% |
The heat map shows percentage changes of major currencies against each other. The base currency is picked from the left column, while the quote currency is picked from the top row. For example, if you pick the Japanese Yen from the left column and move along the horizontal line to the US Dollar, the percentage change displayed in the box will represent JPY (base)/USD (quote).
Author

Christian Borjon Valencia
FXStreet
Markets analyst, news editor, and trading instructor with over 14 years of experience across FX, commodities, US equity indices, and global macro markets.