Microsoft Inc. (MSFT) Elliott Wave technical analysis [Video]
![Microsoft Inc. (MSFT) Elliott Wave technical analysis [Video]](https://editorial.fxstreet.com/images/Markets/Equities/Industries/Software/software-code-637435356353853480.jpg)
MSFT Elliott Wave Analysis Trading Lounge.
MSFT Elliott Wave technical analysis
Function: Counter Trend.
Mode: Corrective.
Structure: Flat.
Position: Minor wave C.
Direction: Downside in wave C of (2).
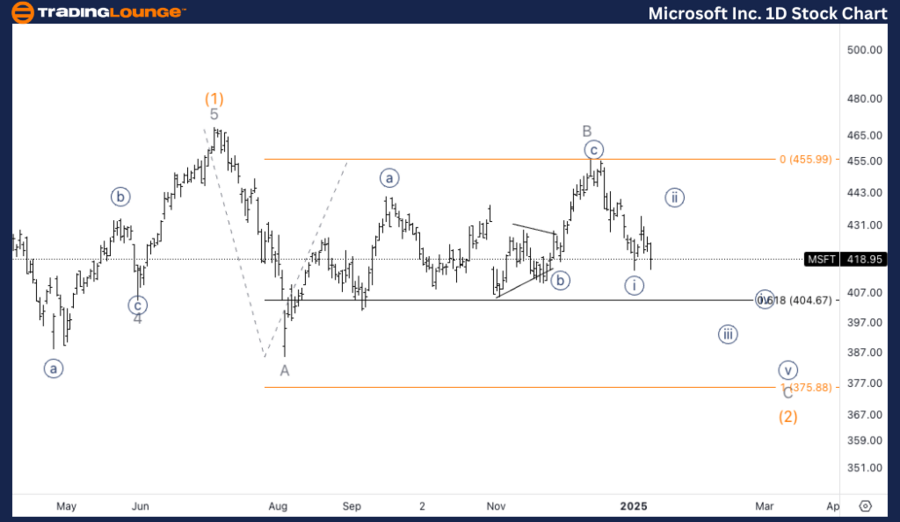
Details: We are looking for downside into what appears to be an Intermediate wave (2). If we were to break and found resistance on top of 400$ we could expect further downside towards MG2 of 300 at 380-372-365.
MSFT Elliott Wave technical analysis – Daily chart
Microsoft appears to be completing a wave C of the corrective wave (2). The downside pressure is evident, and a key level to watch is the $400 mark. If the price breaks and establishes resistance near $400, further downside may be anticipated towards the MinorGroup2 (MG2) support levels around $380, $372, and $365. These levels would serve as potential targets before the correction completes.
MSFT Elliott Wave technical analysis
Function: Counter Trend.
Mode: Corrective.
Structure: Flat.
Position: Wave {i} of C.
Direction: Downside in wave C.
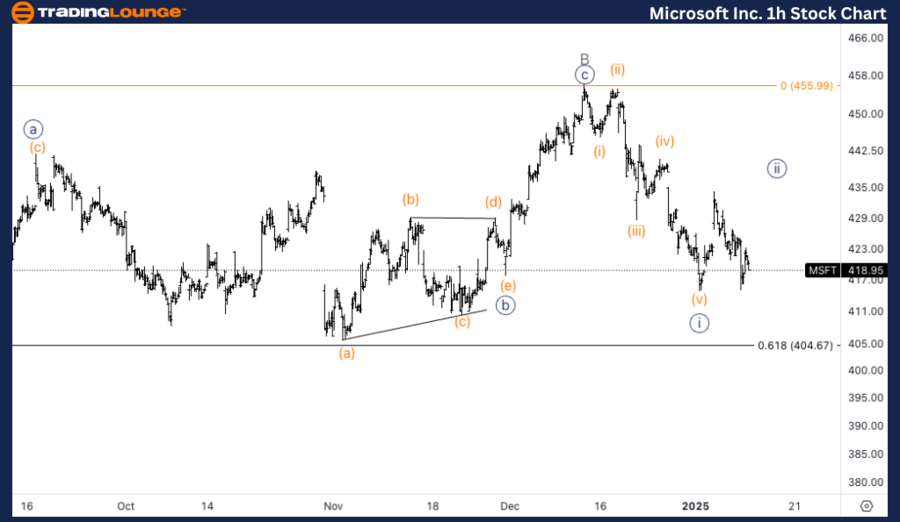
Details: Looking for a potential bounce in wave {ii} of C as we seem to have a five wave move completed in wave {i}. Looking for another leg higher in what could be wave (c) of {ii} and then continue lower.
MSFT Elliott Wave technical analysis – One-hour chart
On the 1-hour chart, a five-wave decline in wave {i} seems to have been completed within the larger wave C. Currently, we are likely to see a corrective bounce in wave {ii}, potentially developing into an (a)-(b)-(c) structure. After this correction, downside is expected to continue in wave {iii} of C, confirming the overall bearish trend until support levels in the 380-365 range are tested.
This Elliott Wave analysis for Microsoft Inc., (MSFT) examines both the daily and 1-hour charts to assess its current market trend, utilizing Elliott Wave Theory to anticipate potential future movements.
Microsoft Inc. (MSFT) Elliott Wave technical analysis [Video]
Author

Peter Mathers
TradingLounge
Peter Mathers started actively trading in 1982. He began his career at Hoei and Shoin, a Japanese futures trading company.