Microsoft Stock Deep Dive: Price target at $230 with near-term risks due to strong US dollar

Welcome back to our deep dive series where we take an in-depth look at some of the most traded and most notable stocks. In this edition, we focus on Microsoft (MSFT). We will as ever go through the two standard valuation models to come up with an average 12-month price target. First, we will outline a discounted cash flow (DCF) valuation and, second, use a comparative or relative valuation model where Microsoft is compared to sector and index peers. We try to differentiate ourselves from the traditional Wall Street analyst community, which appears to operate in a bubble and value companies in isolation from the broader macroeconomy. We think this is a serious drawback of analyst price targets. If you feel I am being harsh on the analyst community just look at historical track records. They are not good. I speak as a former member of the community, so I have some idea!
So let us dive in, but first an idea of what treats are in store for you:
Contents
- Company overview and history
- Wall Street consensus forecasts
- Key valuation rating metrics
- Peer value comparison
- Macroeconomic backdrop, market cycle and sector analysis
- Recent news and earnings
- Forecast and valuation
- Technical analysis
- Executive summary, recommendation and price target
Microsoft (MSFT): Company overview and history
Microsoft is a name synonymous with the computer and software industry and likely needs limited introduction. However, a brief overview follows for those that wish to read on. Microsoft went public via IPO in 1986 but was founded much earlier back in 1975 by Bill Gates and Paul Allen. It quickly went on to develop the MS DOS operating system followed by the Windows operating system. Microsoft now operates across a broad spectrum of businesses all linked to its computer industry origins. Microsoft has the second largest share of the burgeoning cloud industry via its Azure service. It has also made a number of large acquisitions to bolt onto its existing business, the most notable being LinkedIn and Skype. Microsoft is one of the most valuable companies in the world and regularly vies with Apple (AAPL) for the title of the world's most valuable company. It is also a member of the trillion dollar market cap club.
Also read: Apple Stock Deep Dive: AAPL price target at $100 on falling 2023 revenues
Microsoft breaks up its business revenue into three segments for the purposes of reporting. Productivity and Business Processes incorporates Microsoft Office subscriptions from business and personal users, LinkedIn, CRM, Skype and Microsoft Teams. Intelligent Cloud is dominated by the Azure cloud business but also includes SQL Server and other server businesses as well as enterprise solutions for business. Finally, More Personal Computing is the Windows operating system division and includes devices such as the Microsoft Surface, gaming revenue from XBox, and search and advertising revenue is also counted here. As we can see, the Intelligent Cloud division is the growth area, and this has been an area CEO Satya Nadella has focused on since taking over in 2014. Revenue growth and margin are growing strongly in this space.
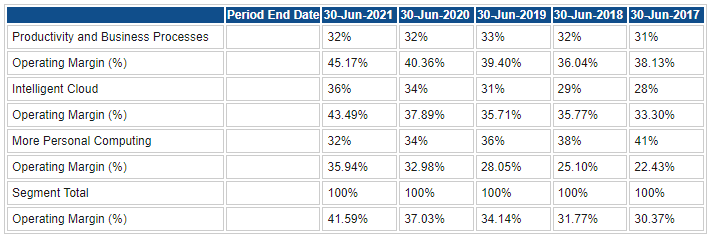
Source: Refinitiv and FXStreet calculations
This year as we know has not been a pleasant one for equity investors, and Microsoft (MSFT) stock has been at least consistent in more or less tracking the fall in both the Nasdaq and S&P 500. Microsoft is down 24% year to date, slightly ahead of the Nasdaq but slightly lagging the S&P 500.
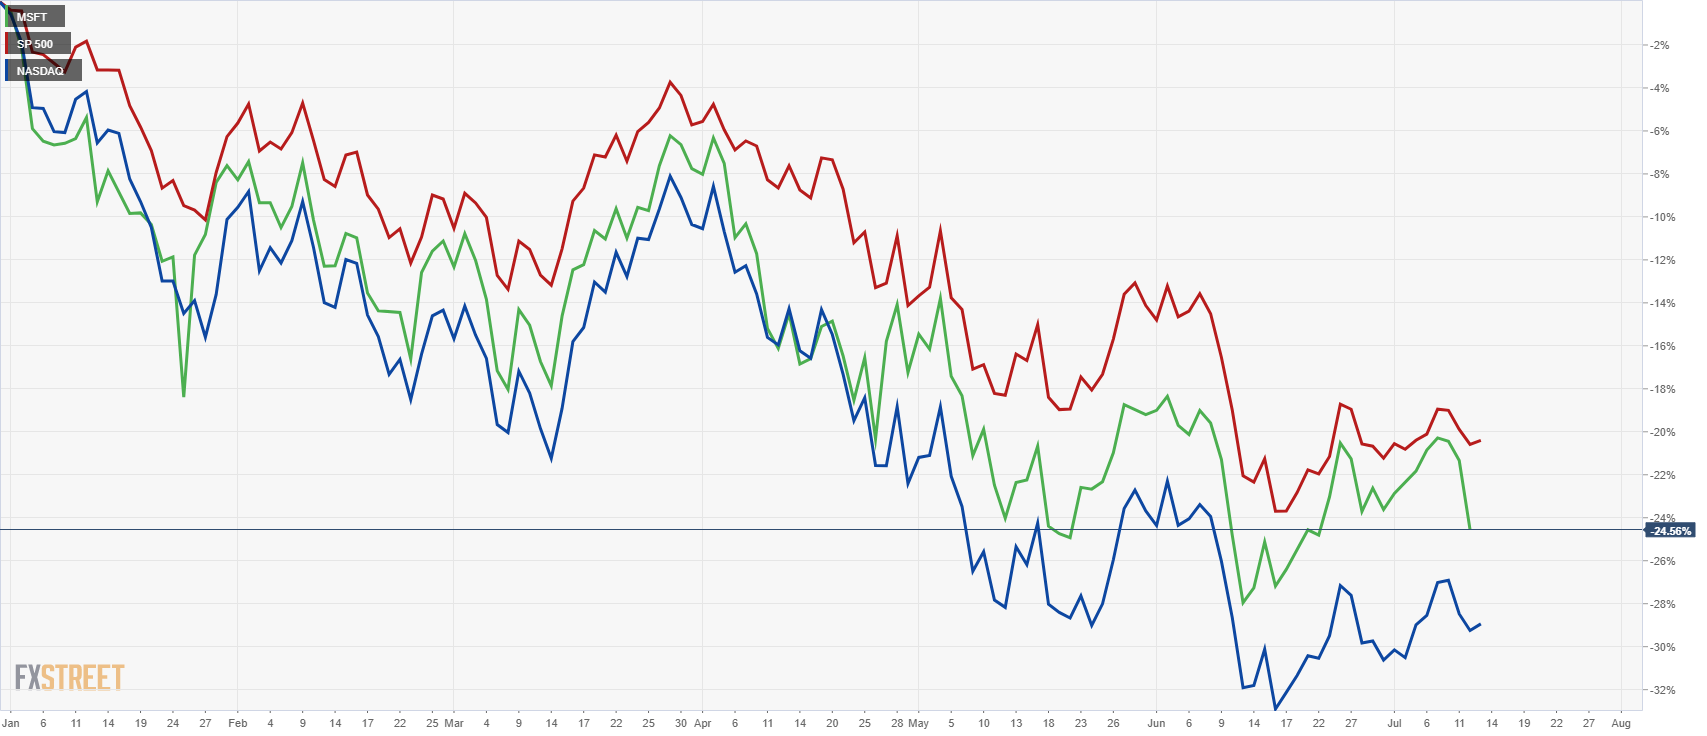
Microsoft (green) versus Nasdaq (blue) and S&P 500 (red) year to date 2022.
However, when we look back over the past five years, the situation changed dramatically in favour of Microsoft. A massive outperformance versus both indices sees MSFT stock up 360% for the past five years versus 140% for the Nasdaq and 70% for the S&P 500.
-637933028549894994.png)
Microsoft (green) versus Nasdaq (blue) and S&P 500 (red) weekly since 2017
MSFT Stock: Wall Street consensus forecasts
As with most stocks, the Wall Street analyst community remains staunchly optimistic with an average price target of $354.25. We again can see clearly how the analyst community reacts to price action with the average target reducing in line but lagging the price decline in Microsoft stock. At the time of writing Microsoft stock is changing hands at $253.67, so there is plenty of upside if those forecasts prove accurate. We think they are highly optimistic and will outline our case below.
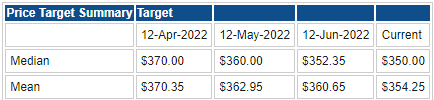
Source: Refinitiv and FXStreet calculations
Microsoft: Key valuation rating metrics
Market Cap: $1.98 trillion
Enterprise Value: $2.29 billion
Free float: 7.47 billion
IPO date: 13-Mar-86
52-week high: $349.67
52-week low: $241.51
Short interest: 0.60%
YTD performance: -21%
3-year performance: 99%
Next earnings date: 25-Jul-22
Microsoft: Peer value comparison
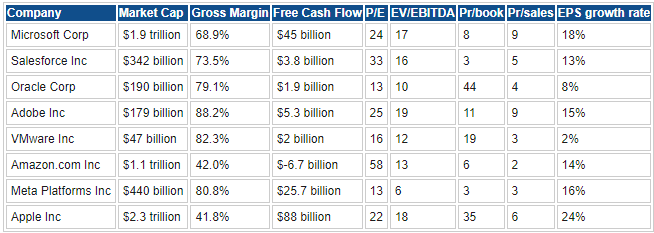
Source: Refinitiv and FXStreet calculations
Macroeconomic backdrop, market cycle and sector analysis
We have mentioned in previous articles the lack of a coherent micro and macro analysis when calculating a price target. Companies very rarely manage to operate outside the sphere of influence of the macroeconomic cycle. Sometimes niche, start-up or micro-cap companies can manage this, but Microsoft meets none of that criteria. Microsoft is a global tech titan and so is subject to macroeconomic and market cycle forces.
Also read: Amazon Stock Deep Dive: AMZN price target at $106 with near-term risks offset by long-term growth
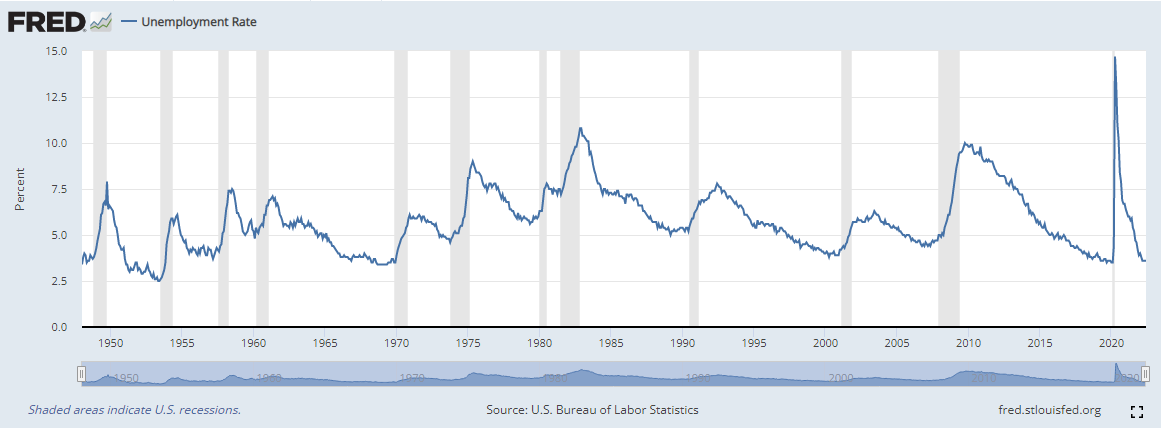
The year to date has not been kind to equities, and as we highlighted above Microsoft has more or less kept pace with the bear market in the main US indices. A bear market was triggered when the S&P 500 dropped 20% from its early January high and the Nasdaq is also in deep bear market territory. Investors have assumed in the past month that the US will enter a recession sooner rather than later and so have been selling and repricing equities in anticipation of this forecasted recession. However, the recent strong jobs report may have put some doubt into this outlook given job growth remains strong and the US unemployment rate is at its cyclical low. It should be noted though that unemployment typically moves to its lowest levels preceding a US recession as the chart below demonstrates.
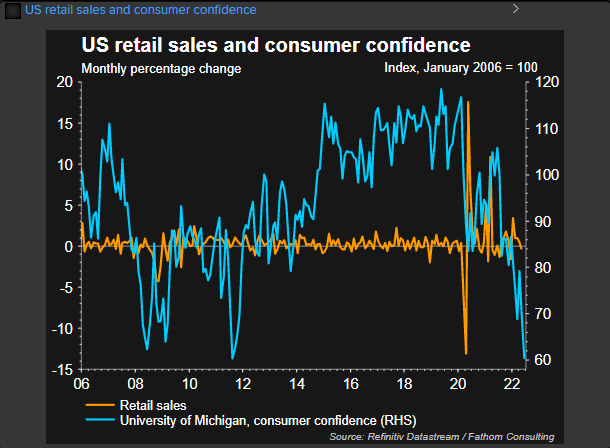
The US consumer makes up about 70% of US GDP, and consumers have been feeling pressure from soaring inflation and changing their behaviour as a result. This has seen record low consumer sentiment surveys in the past month and low levels of consumer spending.
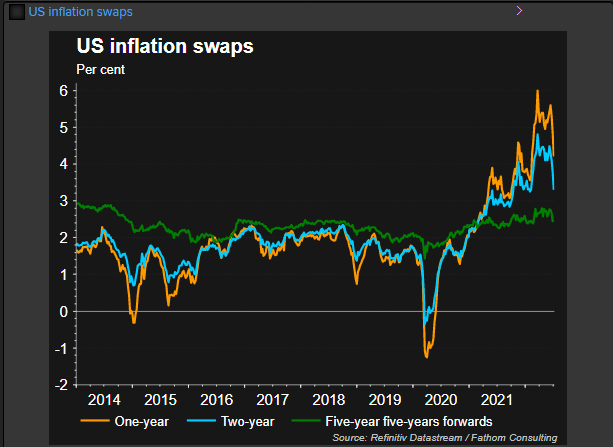
However, the fixed income market is pricing this inflation to be 'transitory' as forward inflation expectations remain moderate. The chart below shows 5-year forward inflation swaps only just above the Fed's 2% inflation target. The fixed income market is predicting a recession to end the inflation spiral.
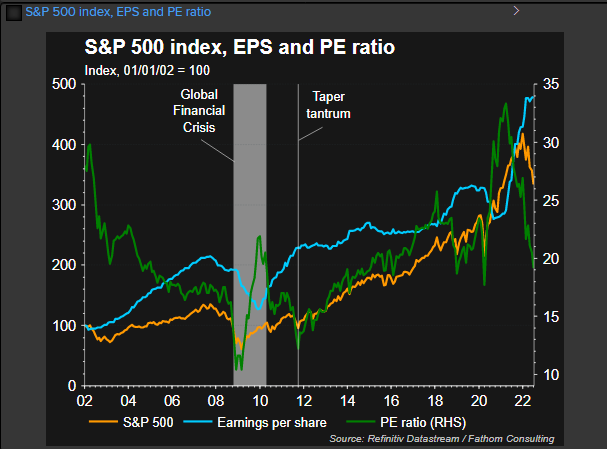
Clearly, the US economy faces more headwinds, and we do feel a recession is likely by the end of this year, which should see some further falls in US equity prices. We feel at least half of this is priced into current equity valuations though. The P/E ratio of the S&P 500 has fallen sharply this year and is now closer to its 20-year average. We think this next earnings season will see equities bottom out as corporate earnings and more especially future guidance reflects the likelihood of recession and inflation.
Our other broad-based concern for the likes of Microsoft and other globalized US equities revolves around the current strength of the US dollar. The dollar is at 20-year highs against the yen, euro and sterling. US-based companies that operate on a global scale naturally earn considerable revenue in foreign currencies, which is then converted into dollars for the purposes of financial reporting. The stronger dollar hurts overseas revenues. A strong dollar has a strong correlation with falling earnings as the chart below demonstrates.
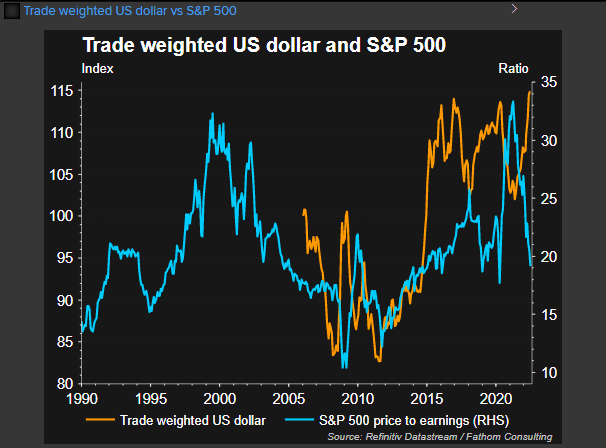
To conclude, the macro environment remains challenging with further falls possible for equity indices. A strong dollar adds a further headwind to Microsoft's revenue, and indeed Microsoft already warned in early June that the strong dollar would impact earnings. Since then the dollar has appreciated a further 6% on a trade-weighted basis, a significant amount.
Microsoft news and earnings
Microsoft will report its Q3 earnings on July 25. The last earnings report in April saw a beat on both top and bottom lines. Earnings per share came in at $2.22 versus the $2.18 estimate, and revenue was $49.36 billion, marginally ahead of the $49 billion estimate. Microsoft stock initially reacted well to the earnings beat, but the stock then fell as global equities tumbled. Recently in early June Microsoft warned that the strong dollar would hurt guidance and result in a $460 million hit to revenue. Microsoft also announced this week a small number of layoffs in an email to CNBC.
Today we notified a small number of employees that their roles have been eliminated (...) This was a result of a strategic realignment, and, like all companies, we evaluate our business on a regular basis. We continue to invest in certain areas and grow headcount in the year ahead.”
Microsoft forecast and valuation
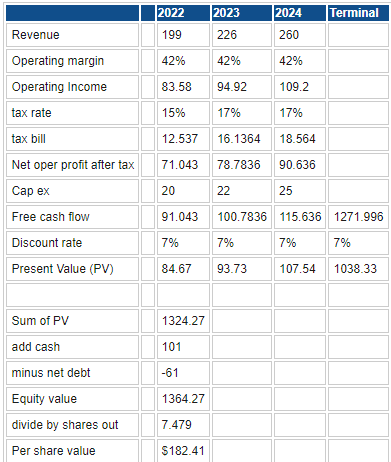
We use two valuation methods, discounted cash flow (DCF) and relative valuation. DCF aims to forecast future expected cash flows and discount them to present value to come up with a valuation for the company. We make assumptions for long-term growth rates to predict the long-term revenue stream. A relative valuation model is perhaps simpler to follow and construct. Again using forward earnings, we apply sector price/earnings ratios and look at best and worst case scenarios to arrive at a predicted price target for Microsoft.
Source: Refinitiv and FXStreet calculations
Our DCF modeling gives us a predicted share price of $182.41 versus the current price of $253. We use Refinitiv average analyst revenue forecasts as we tend to agree with the herd for once! Where we do see some potential upside is on the margin front. As we can see from the chart below, Microsoft suffered a margin downturn following the Great Financial Crisis, which bottomed out in 2016.
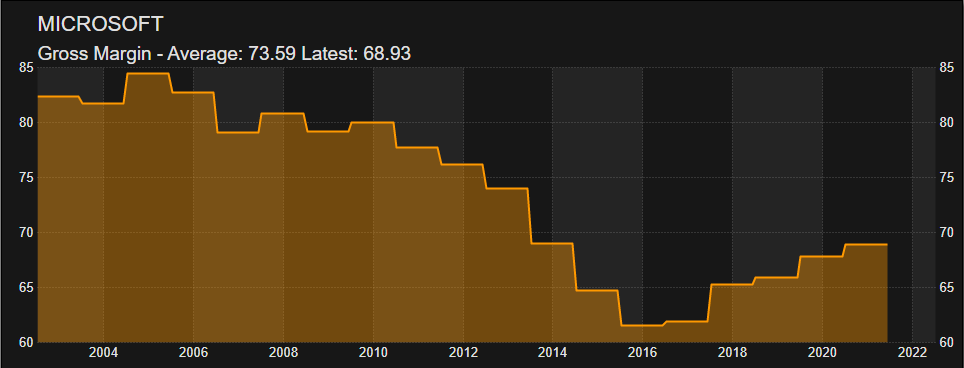
Since then Microsoft has been growing margins, and the latest inflationary pressures give further opportunities to grow margins in the Azure cloud space due to Microsoft's dominant market position there. Amazon Web Services (AWS) has topped the cloud sector, but Microsoft, as mentioned, has been growing aggressively in the sector under the direction of its current CEO who clearly identifies the potential in the space. Amazon has struggled recently, and we feel corporate customers will be more enamored with Microsoft. We expect Microsoft to take the number one spot in cloud market share over the next three years.
Also read: Tesla Stock Deep Dive: Price target at $400 on China headwinds, margin compression, lower deliveries
However, even adjusting up our margins and revenue forecasts still leads to a DCF valuation of $205 at the top end of our estimates.
Using the perhaps more followed relative valuation method below, we outline three different scenarios.
First, here is an explanation of the price/earnings ratio we use. Currently, the forward P/E of Microsoft is 25, so we use that for 2022 forecasts. However, the long-term average forward P/E for Microsoft is 18.9, so we use this for 2023 onwards. This is a very conservative estimate in our view as it includes the 2008 Great Financial Crisis when the P/E traded below 10!
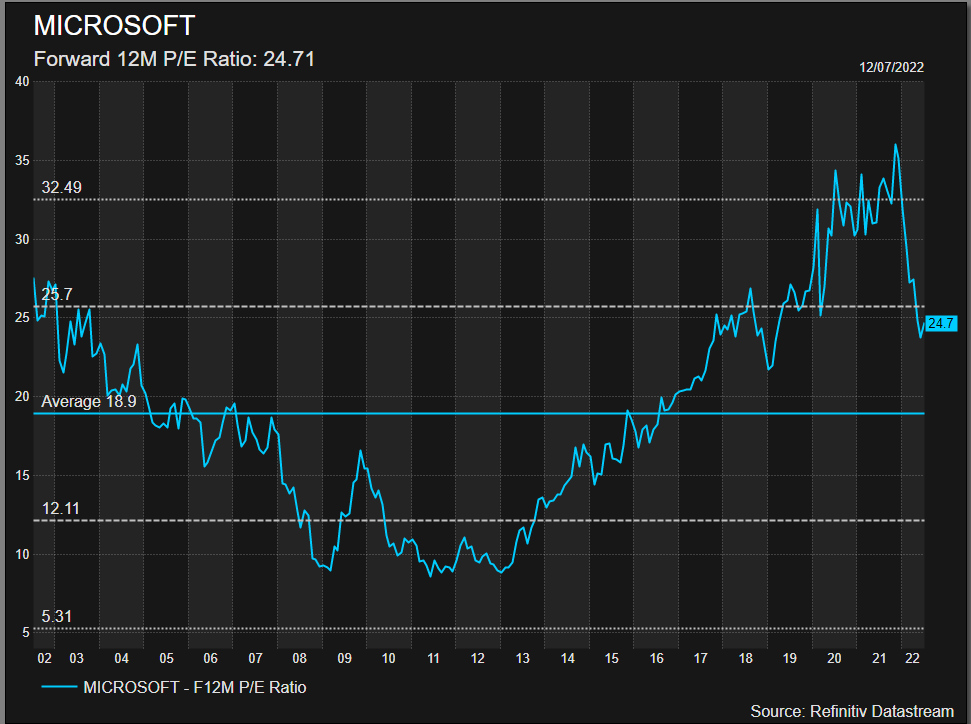
The range of price estimates is from $202 to $266. However, the median is closer to $230, and we are more comfortable with that given we do not expect the P/E ratio to decline below 20.
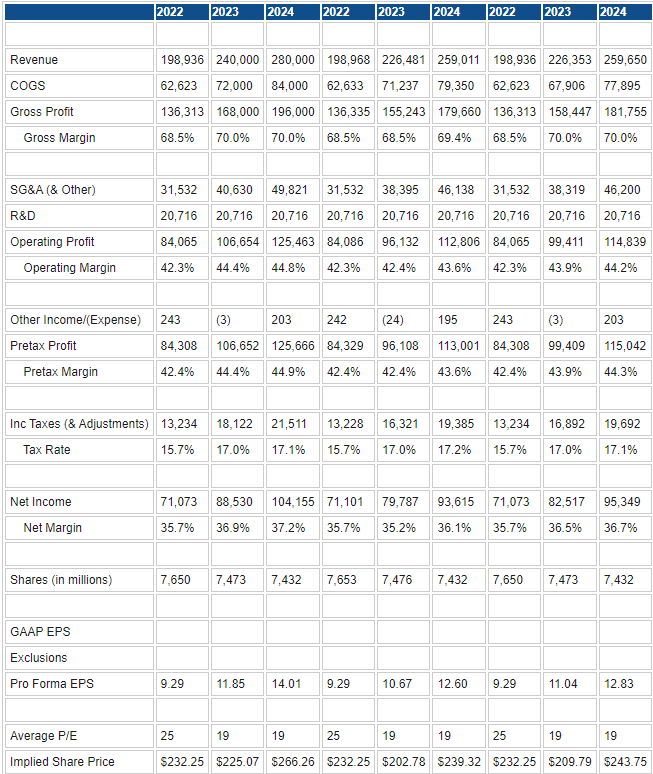
Source: Refinitiv and FXStreet calculations and forecasts
Clearly then using both valuation methods sees more downside for MSFT stock. The DCF best case scenario is $205, and our base P/E valuation is $230. This does fit into the current narrative of equities losing perhaps another 10% before bottoming out later in 2022. To add to our analysis, however, we must also consider the technical outlook for Microsoft.
Microsoft technical analysis
A strong downtrend in place for 2022 is in keeping with the overall trends in the stock market. There is some strong support at the $205 to $210 zone with the large volume profile bar. This means a lot of volume has traded at this level, indicating stability and price acceptance. It was a consolidation in the uptrend from the March 2020 pandemic lows, so it should again function as a consolidation zone, just this time in a downtrend.
The key question is if it can function as a reversal zone. Below $200 is a volume gap that could lead to a washout toward $180 and so break the pandemic lows. Many tech stocks are retreating to pre-pandemic lows as the effects of the Fed monetary policy are completely reversed. However, Microsoft is not a high-growth tech stock. It has a long track record and is stable and profitable. In that regard, we would not expect it to follow other growth stocks lower. As such, we favour it to outperform the Nasdaq and see $205 as the low.
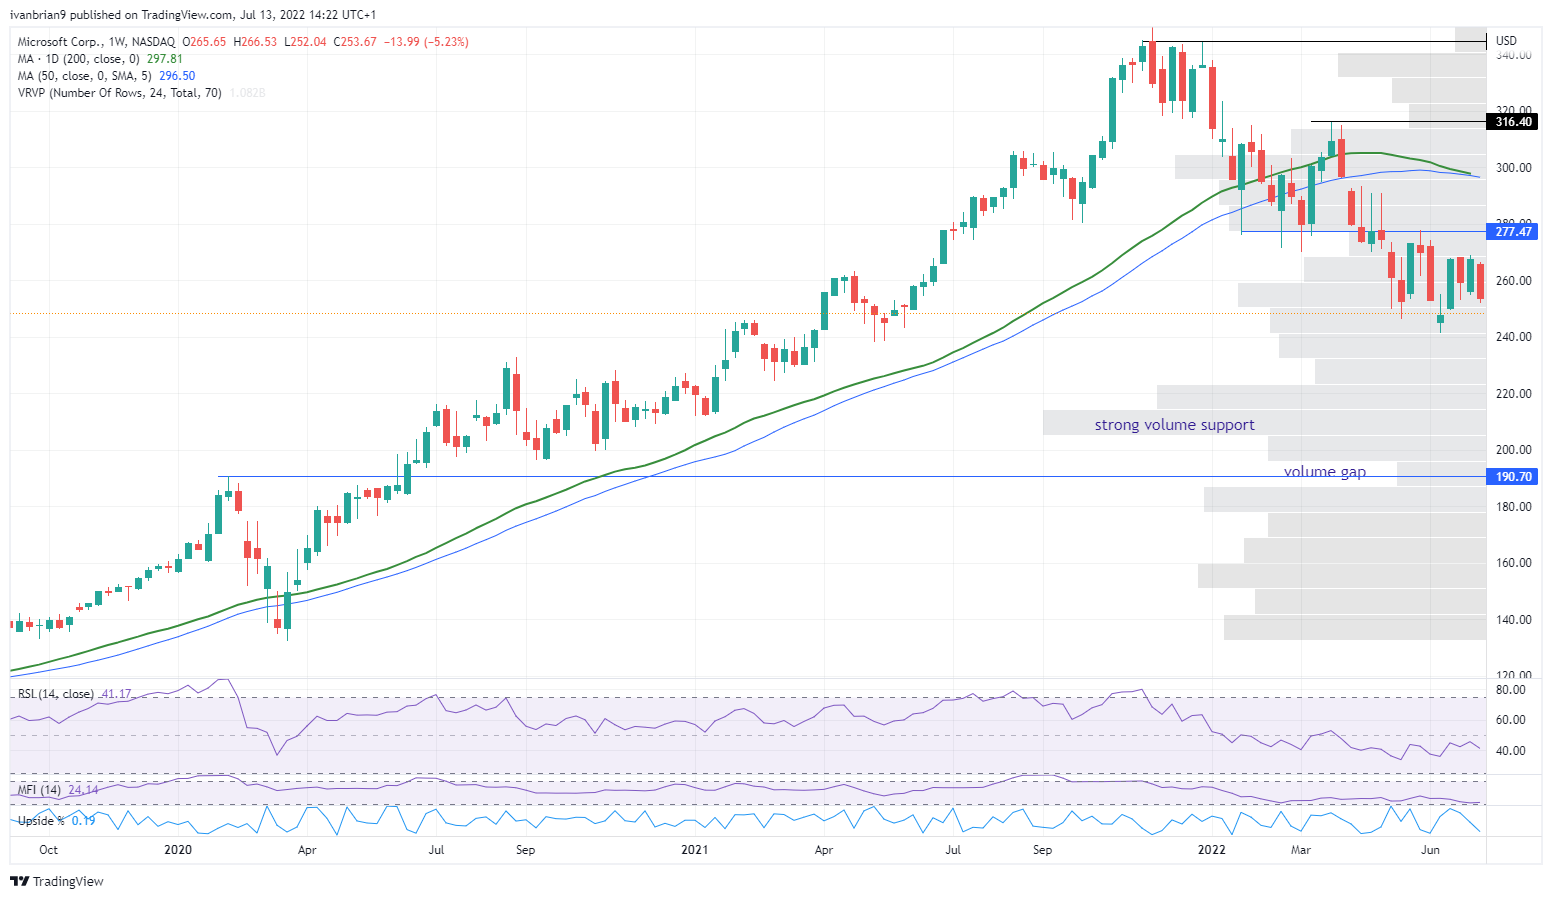
Microsoft stock, weekly
Microsoft: Executive summary, recommendation and price target
$205 is our base case valuation and also our technical support from the chart above. That is some 20% below current prices. The standard for price target among the analyst community is to opt for a 12-month time horizon. We feel Microsoft will indeed move lower over the next three to six months but will then find support based on strong fundamentals, cash generation and margin performance. This coupled with a recovery in the stock market sometime in the first half of 2023 leads us to opt for a $230 price target. This then necessitates a Sell rating based on current prices. We feel more short-term pressure from the strong dollar and overall weak macro environment may present some opportunities within late 2022 and will update our model and recommendation accordingly after the next earnings report.
Upside risks to our valuation
- S&P 500 bottoms out post-Q2 earnings. Greater than a 50% chance in our view. Not mentioning Nasdaq to bottom as it may struggle given high growth duration metrics.
- Microsoft bottoms out after the July earnings report.
Downside risks to our valuation
- Deep US recession akin to 2008 Great Financial Crisis.
- We do not see inflation as big an issue for Microsoft as with other stocks in our coverage. It has a dominant position and can pass on costs.
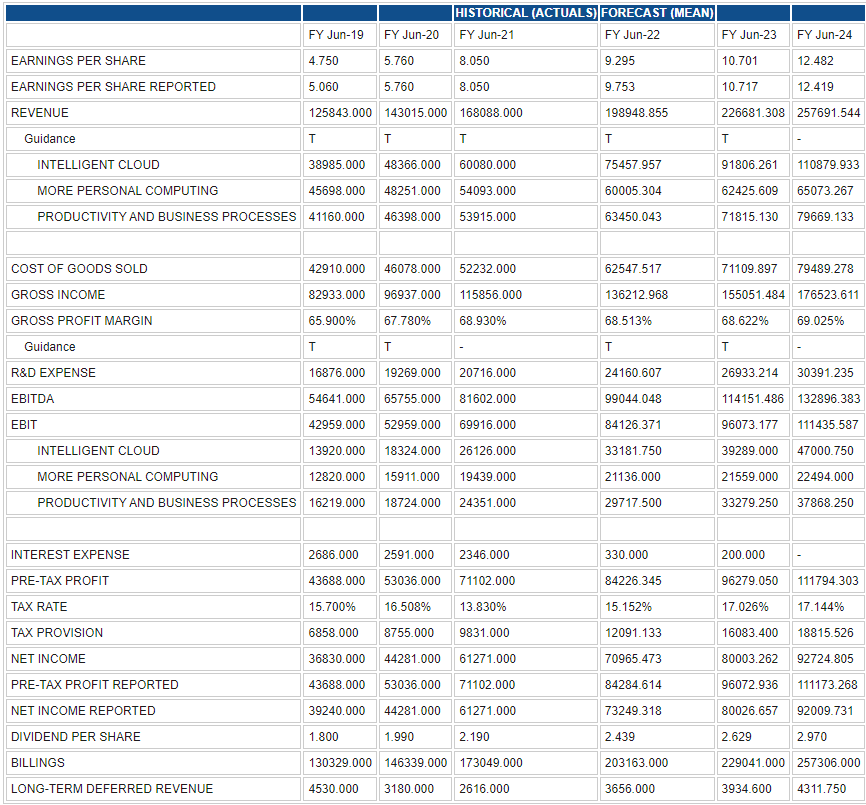
Below are historic and forecast data from Refinitiv that we use for our modelling. We then adjust accordingly.
Like this article? Help us with some feedback by answering this survey:
Author

Ivan Brian
FXStreet
Ivan Brian started his career with AIB Bank in corporate finance and then worked for seven years at Baxter. He started as a macro analyst before becoming Head of Research and then CFO.


