![]() Barry Weinstein
Barry Weinstein
Volatility Markets Newswire
Most consistent gainer
Using the VolatilityMarkets software to structure a Merck trend following trade idea
Part 1) Introduction
VolatilityMarkets suggests trend-inspired trades that capitalize on market trends.
In the short term Merck has been accelerating higher. In the long term Merck has been decelerating higher. With the long term trend being the stronger of the two, we propose a long trade idea with a time horizon.
Part 2) Trade Idea Details
2A) Trade Idea Graph
2b) Intraday Predictions
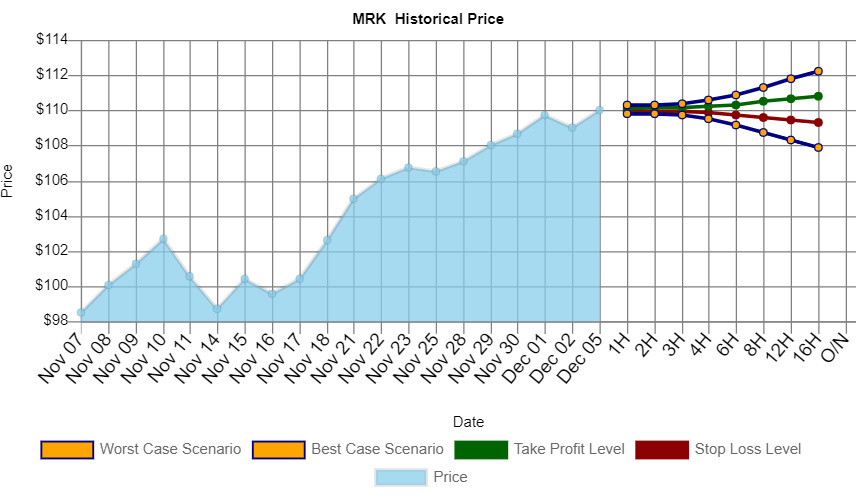
Buy $ 149,380 USD of Merck, take profit at $ 110.7768 level with 49.99% odds for a $ 1,000 USD gain,stop out at $ 109.3034 with 50.0% odds for a $ 1,000 USD loss through O/N time horizon
Part 3) MRK Trend Analysis
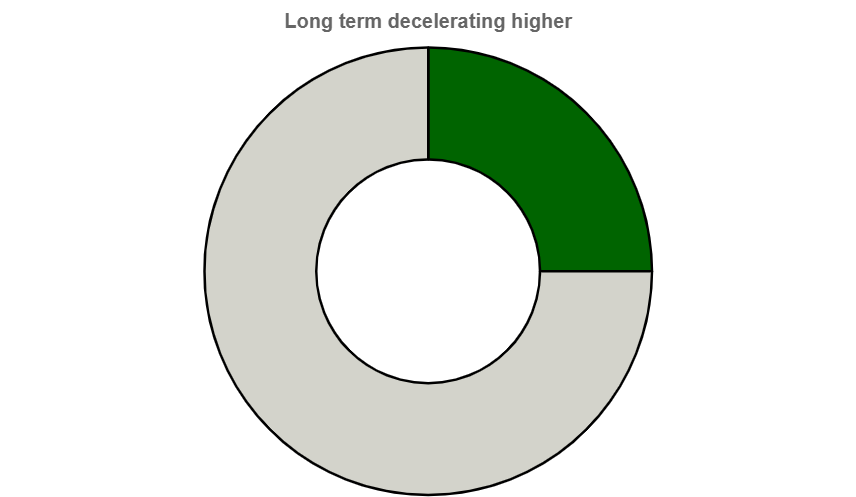
MRK last price was $ 110.04. The long-term trend decelerating higher is stronger than the short-term trend accelerating higher. This trade goes long when the price was moving higher but decelerating over the past 19 days.
Part 4) MRK value analysis
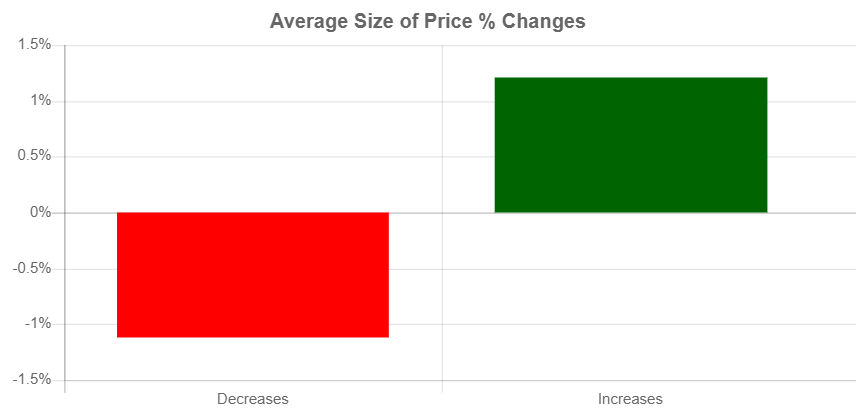
Over the past 19 days, the MRK price increased 14 days and decreased 5 days. For every up day, there were 0.36 down days. The average return on days where the price increased is 1.2041% The average return on days where the price decreased is -1.1223% Over the past 19 Days, the price has increased by 11.72% percent. Over the past 19 days, the average return per day has been 0.6168% percent.
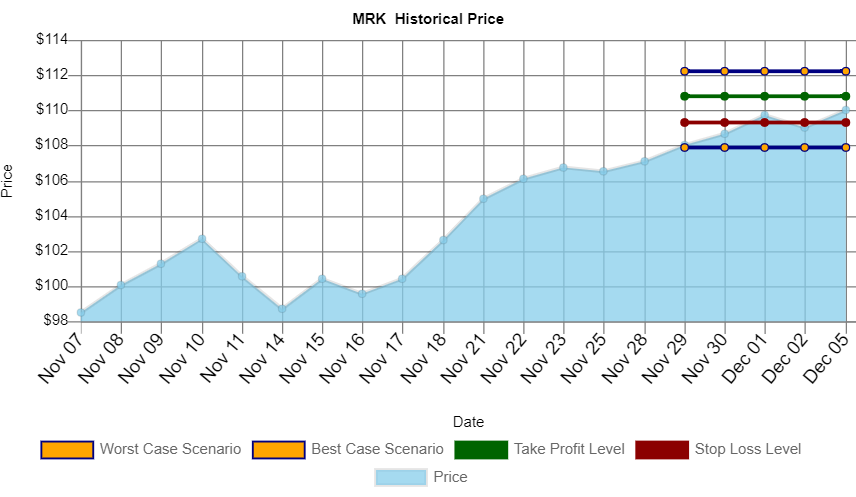
Part 5) MRK worst/best case scenario analysis
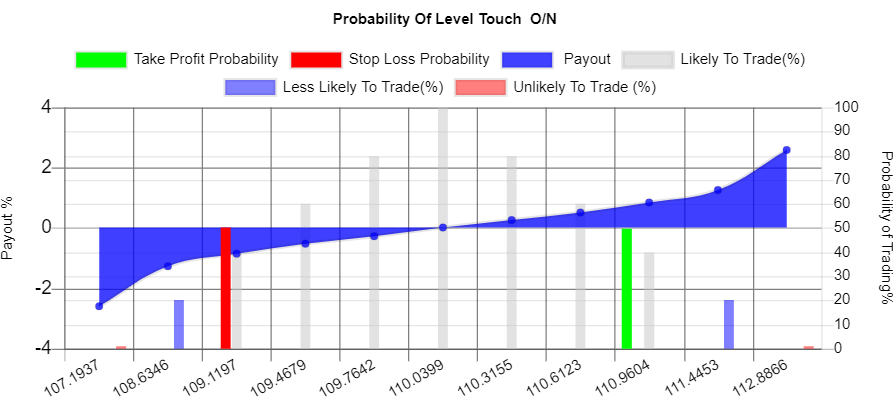
Within 1 week, our worst case scenario where we are 95% certain that this level won't trade for MRK, is $ 107.8817 , and the best case scenario overnight is $ 112.1983 . levels outside of this range are unlikely, but still possible, to trade. We are 50% confident that $ 109.3034 could trade and that $ 110.7768 could trade. These levels are within statistical probability.
Key takeaways
-
Price today $ 110.04.
-
Over the past 19 days, the MRK price increased 14 days and decreased 5 Days.
-
For every up day, there were 0.36 down days.
-
The average return on days where the price increased is 1.2041%.
-
The average return on days where the price decreased is -1.1223%.
-
Over the past 19 Days, the price has increased by 11.72% percent.
-
Over the past 19 days, the average return per day has been 0.6168% percent.
-
Over the past 19 days, The price has on average been decelerating: $ -0.0294 per day higher.
-
Over the last session, the price increased by $ 1.04.
-
Over the last session, the price increased by 0.9451 %.
-
Over the last session, the price accelerated by $ 0.29.
Volatility Markets provides trend following trade ideas for momentum traders. The Volatility Markets Newswire measures the direction and acceleration of a security and then structures a trade idea to capitalize on the trend. While trends have been shown to exist in markets over the past 100 years, they are no guarantee of future asset prices. You should take these ideas lightly and at your own risk.
Recommended content
Editors’ Picks
EUR/USD edges lower toward 1.0700 post-US PCE

EUR/USD stays under modest bearish pressure but manages to hold above 1.0700 in the American session on Friday. The US Dollar (USD) gathers strength against its rivals after the stronger-than-forecast PCE inflation data, not allowing the pair to gain traction.
GBP/USD retreats to 1.2500 on renewed USD strength

GBP/USD lost its traction and turned negative on the day near 1.2500. Following the stronger-than-expected PCE inflation readings from the US, the USD stays resilient and makes it difficult for the pair to gather recovery momentum.
Gold struggles to hold above $2,350 following US inflation

Gold turned south and declined toward $2,340, erasing a large portion of its daily gains, as the USD benefited from PCE inflation data. The benchmark 10-year US yield, however, stays in negative territory and helps XAU/USD limit its losses.
Bitcoin Weekly Forecast: BTC’s next breakout could propel it to $80,000 Premium

Bitcoin’s recent price consolidation could be nearing its end as technical indicators and on-chain metrics suggest a potential upward breakout. However, this move would not be straightforward and could punish impatient investors.
Week ahead – Hawkish risk as Fed and NFP on tap, Eurozone data eyed too

Fed meets on Wednesday as US inflation stays elevated. Will Friday’s jobs report bring relief or more angst for the markets? Eurozone flash GDP and CPI numbers in focus for the Euro.