Grasim Industries Elliott Wave technical analysis [Video]
![Grasim Industries Elliott Wave technical analysis [Video]](https://editorial.fxstreet.com/images/Markets/Equities/Ibex/madrid-stock-exchange-spain-eu-16703960_XtraLarge.jpg)
Grasim Industries Elliott Wave technical analysis
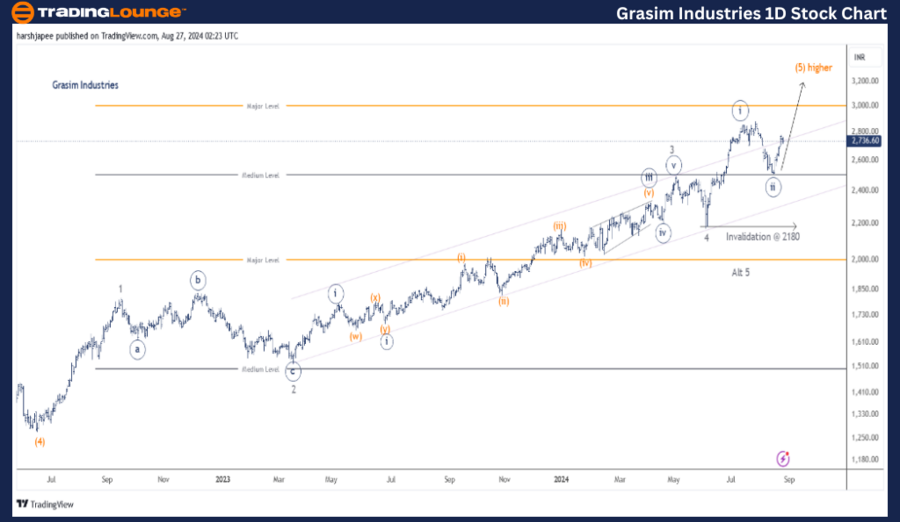
Function: Larger Degree trend Higher (Intermediate degree, orange. Wave (5)).
Mode: Motive.
Structure: Impulse.
Position: Minute Wave ((ii)) Navy.
Details: Minute Wave ((iii)) Navy of Minor Wave 5 Grey progressing higher within Intermediate Wave (5) Orange against 2180. Alternatively, Wave (5) Orange is complete above 2900.
Invalidation point: 2180.
Grasim Industries daily chart technical analysis and potential Elliott Wave counts:
Grasim Industries’ Daily Chart is suggesting a continued push higher towards the larger uptrend as Minor Wave 5 Grey is unfolding as an impulse against 2180 mark. Minute Wave ((iii)) is ideally about to resume after Wave ((ii)) bottomed around 2500 level.
The stock terminated Intermediate Wave (4) around 1270 mark in June 2022. Since then Minor Waves 1,3 and 4 seem to be complete and prices are now progressing higher within Minor Wave 5 Grey to terminate Intermediate Wave (5).
Alternatively, Minor Wave 5 completed around the 2900 mark and bears are inclined to drag further lower. Bottom line is 2180 low and a break there would confirm the alternate scenario unfolding. Immediate support is around 2500 level.
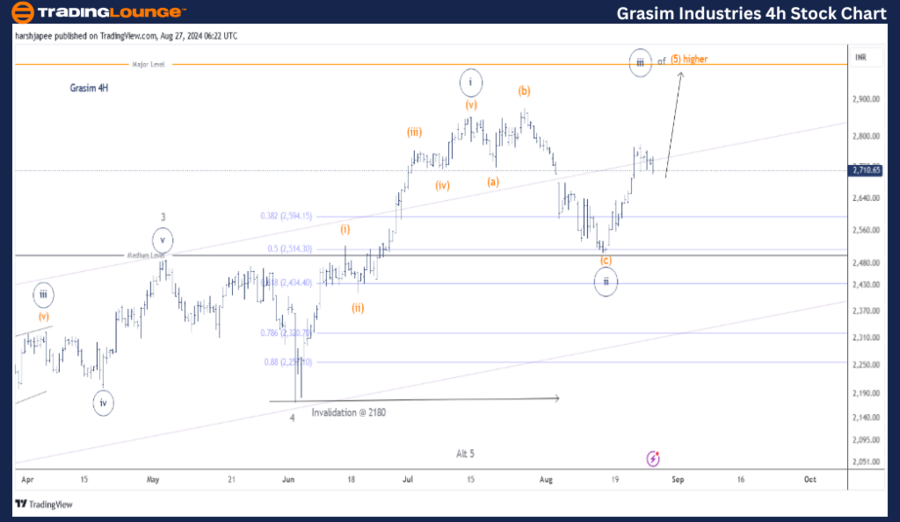
Function: Larger Degree trend Higher (Intermediate degree, orange. Wave (5)).
Mode: Motive.
Structure: Impulse.
Position: Minute Wave ((ii)) Navy.
Details: Minute Wave ((iii)) Navy of Minor Wave 5 Grey progressing higher within Minor Wave 5 Grey of Intermediate Wave (5) Orange against 2180. Alternatively, Wave (5) Orange is complete above 2900.
Invalidation point: 2180.
Grasim Industries four-hour chart technical analysis and potential Elliott Wave counts:
Grasim Industries 4H chart reveals the sub waves since Minor Wave 4 terminated around 2180 mark. The stock is progressing within Minute Wave ((iii)) against 2500 mark near term. Also note that Minute Wave ((ii)) terminated around fibonacci 0.50 of Wave ((i)).
Going into the sub waves further, Minute Wave ((i)) ideally produced an impulse between 2180 and 2860 levels. Minute Wave ((ii)) marked as an expanded flat, has potentially terminated around the 2500 levels. If the above holds well, Grasim should progress higher with prices above 2500 broadly.
Conclusion
Grasim Industries is progressing higher within Minute Wave ((iii)) of Minor Wave 5 Grey, within Intermediate Wave (5) against 2180.
Grasim Industries Elliott Wave technical analysis [Video]
Author

Peter Mathers
TradingLounge
Peter Mathers started actively trading in 1982. He began his career at Hoei and Shoin, a Japanese futures trading company.


