-
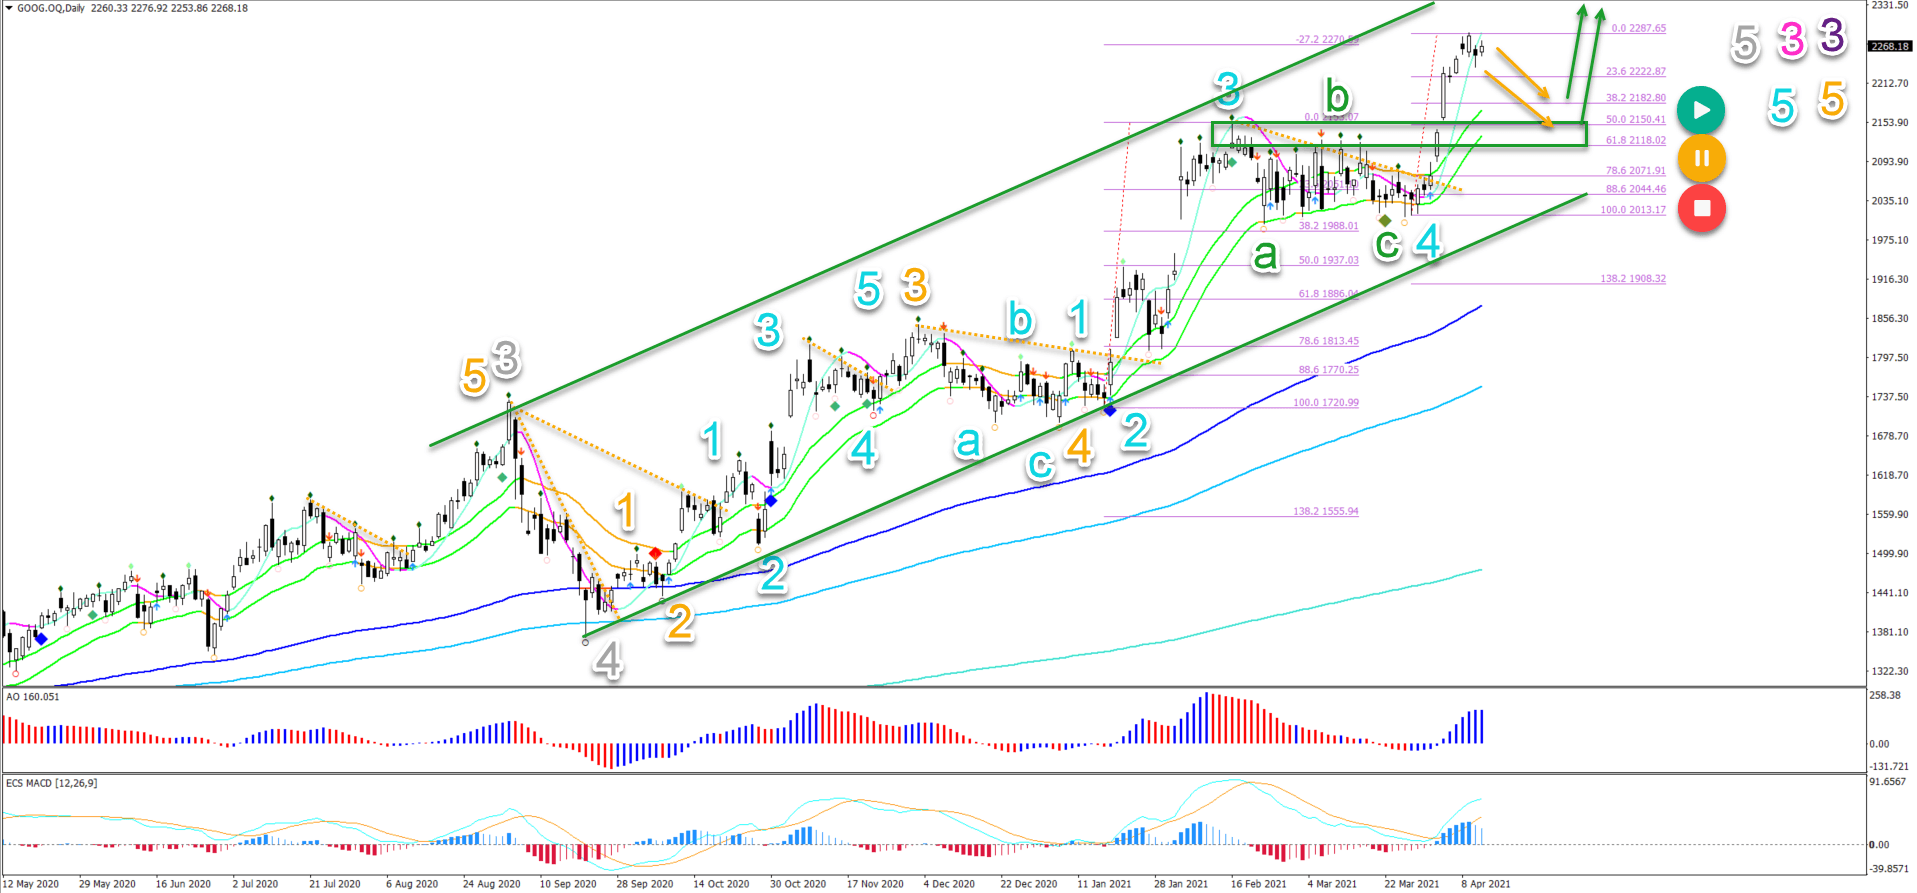
Alphabet stock (GOOG) made a strong bullish breakout above the triangle pattern. The breakout is taking place in a well established uptrend channel (green lines).
-
The current bullish price swing is part of a larger wave 3 (pink) of wave 3 (purple), which indicates that more upside is likely.
-
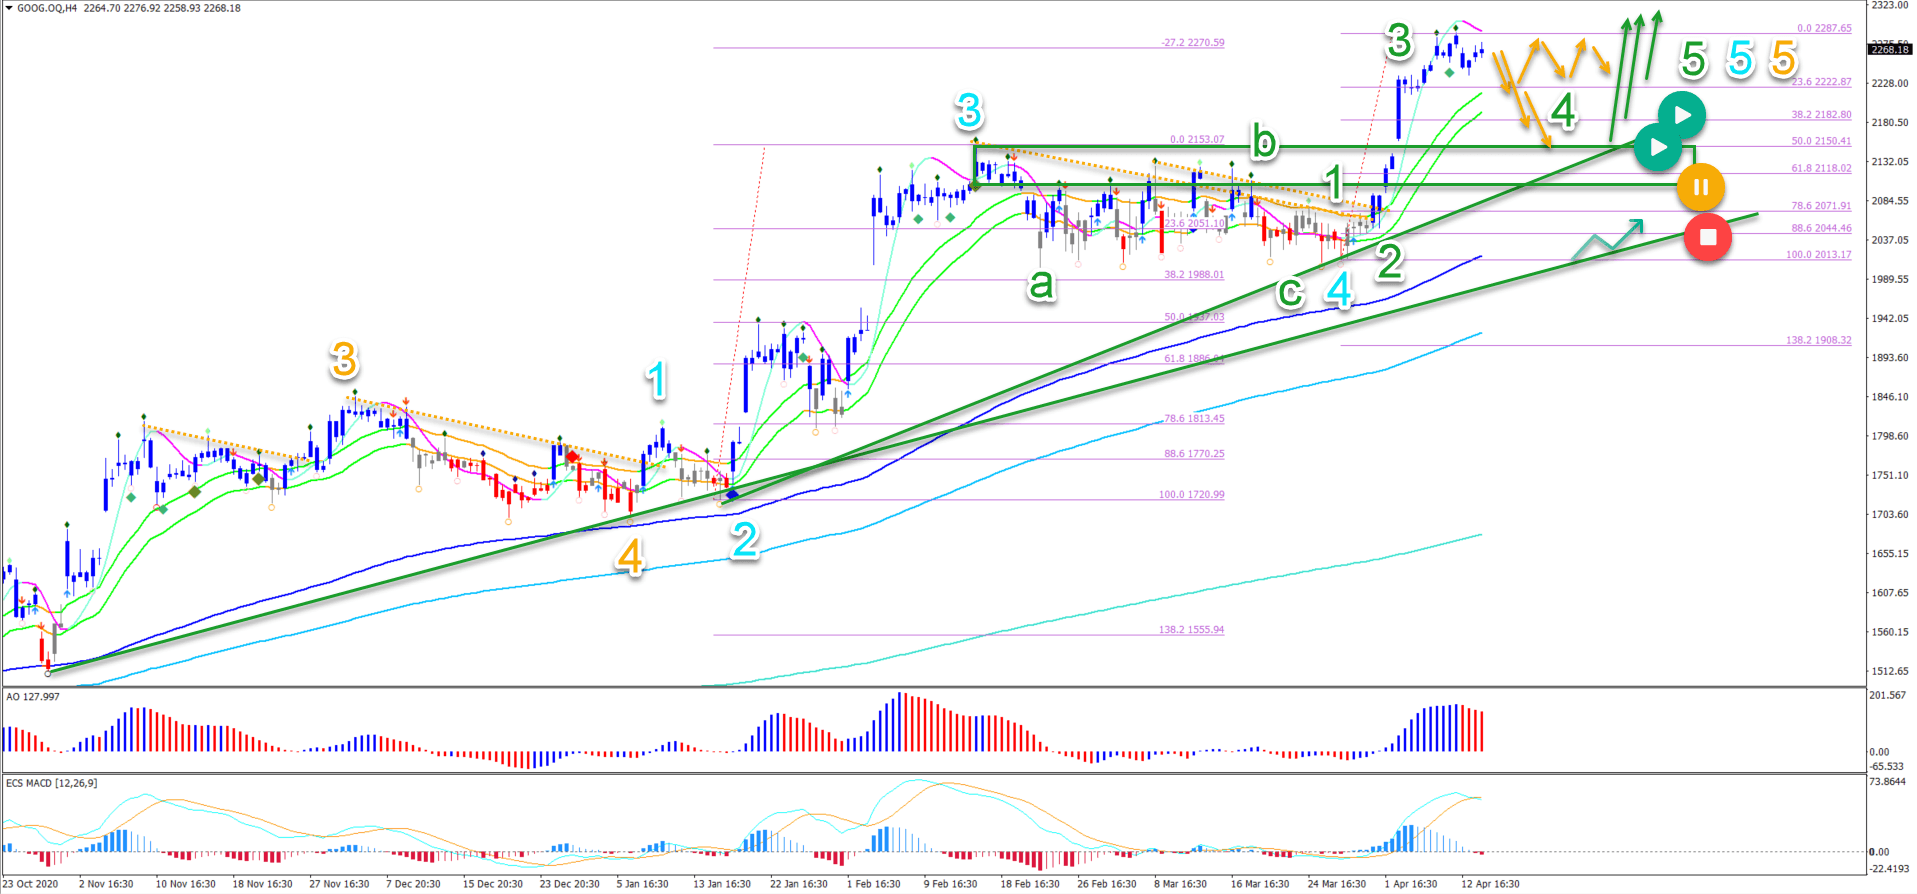
On the 4 hour chart, we can see multiple waves 3 already appear in the recent past. This is indicating a strong uptrend.
This article reviews whether the uptrend can continue higher or not. We also review key support and resistance levels plus potential targets.
Price charts and technical analysis
The GOOG stock triangle chart pattern completed an ABC (green) within a shallow wave 4 pullback.
Price action bounced at the 38.2% Fibonacci level and has already reached the -27.2% Fibonacci target. What can be expected next?
-
No divergence pattern is visible so far. This means that the uptrend remains strong and impulsive, which is indicating that bulls remain in control.
-
The current bullish price swing is part of a larger wave 3 (pink) of wave 3 (purple), which indicates that more upside is likely.
-
A full uptrend is visible with a clear uptrend channel (green lines) and moving averages aligned with the 21 ema above the 144 ema and above the 233 and 610 emas.
-
Considering the strong price push away from the 21 ema, it is likely that the Fibonacci levels of the most recent price swing will act as support and cause a bounce (green arrows) if a pullback occurs (orange arrows).
-
The next targets are located at $2400, $2500, and $2600.
On the 4 hour chart, we can see multiple waves 3 already appear in the recent past. This is indicating a strong uptrend.
-
Currently price is in a wave 3 (green). Price could continue higher within wave 3.
-
Eventually now or later, a shallow pullback (orange arrows) could confirm the end of the wave 3 (green) and the start the wave 4 (green).
-
The Fibonacci levels are expected to act as support for a bounce (green arrows).
-
A break below the previous tops (green box) could place the current wave outlook on hold (orange circle) or invalidate it (red circle).
-
A deeper retracement does not mean that the uptrend is over. Price action could still bounce at the 144 ema close.
The analysis has been done with the ecs.SWAT method and ebook.
Elite CurrenSea Training Program(s) should not be treated as a recommendation or a suggestion to buy or sell any security or the suitability of any investment strategy for Student. The purchase, sale, or advice regarding any security, other financial instrument or system can only be performed by a licensed Industry representative; such as, but not limited to a Broker/Dealer, Introducing Broker, FCM and/or Registered Investment Advisor. Neither Elite CurrenSea nor its representatives are licensed to make such advisements. Electronic active trading (trading) may put your capital at risk, hence all trading decisions are made at your own risk. Furthermore, trading may also involve a high volume & frequency of trading activity. Each trade generates a commission and the total daily commission on such a high volume of trading can be considerable. Trading accounts should be considered speculative in nature with the objective being to generate short-term profits. This activity may result in the loss of more than 100% of an investment, which is the sole responsibility of the client. Any trader should realise the operation of a margin account under various market conditions and review his or her investment objectives, financial resources and risk tolerances to determine whether margin trading is appropriate for them. The increased leverage which margin provides may heighten risk substantially, including the risk of loss in excess of 100% of an investment.
Recommended content
Editors’ Picks
EUR/USD retreats below 1.0700 after US GDP data

EUR/USD came under modest bearish pressure and retreated below 1.0700. Although the US data showed that the economy grew at a softer pace than expected in Q1, strong inflation-related details provided a boost to the USD.
GBP/USD declines below 1.2500 as USD rebounds

GBP/USD declined below 1.2500 and erased the majority of its daily gains with the immediate reaction to the US GDP report. The US economy expanded at a softer pace than expected in Q1 but the price deflator jumped to 3.4% from 1.8%.
Gold drops below $2,320 as US yields shoot higher

Gold lost its traction and turned negative on the day below $2,320 in the American session on Thursday. The benchmark 10-year US Treasury bond yield is up more than 1% on the day above 4.7% after US GDP report, weighing on XAU/USD.
XRP extends its decline, crypto experts comment on Ripple stablecoin and benefits for XRP Ledger

Ripple extends decline to $0.52 on Thursday, wipes out weekly gains. Crypto expert asks Ripple CTO how the stablecoin will benefit the XRP Ledger and native token XRP.
After the US close, it’s the Tokyo CPI

After the US close, it’s the Tokyo CPI, a reliable indicator of the national number and then the BoJ policy announcement. Tokyo CPI ex food and energy in Japan was a rise to 2.90% in March from 2.50%.

