|premium|

Goldman Sachs (GS Stock) still looking higher after Q3 results

The Goldman Sachs Group, Inc. (GS) is an American multinational investment bank and financial services company headquartered in New York City. It offers services in investment management, securities, asset management, prime brokerage, and securities underwriting.

Since March 2020 low, GS is moving with a bullish momentum. The structure of this movement in Elliott Theory we call a motive wave or impulse. If you want to learn more about Elliott Wave Theory, please follow this link: Elliott Wave Theory. This impulse needs to build 5 waves before a correction.

GS daily chart

GS

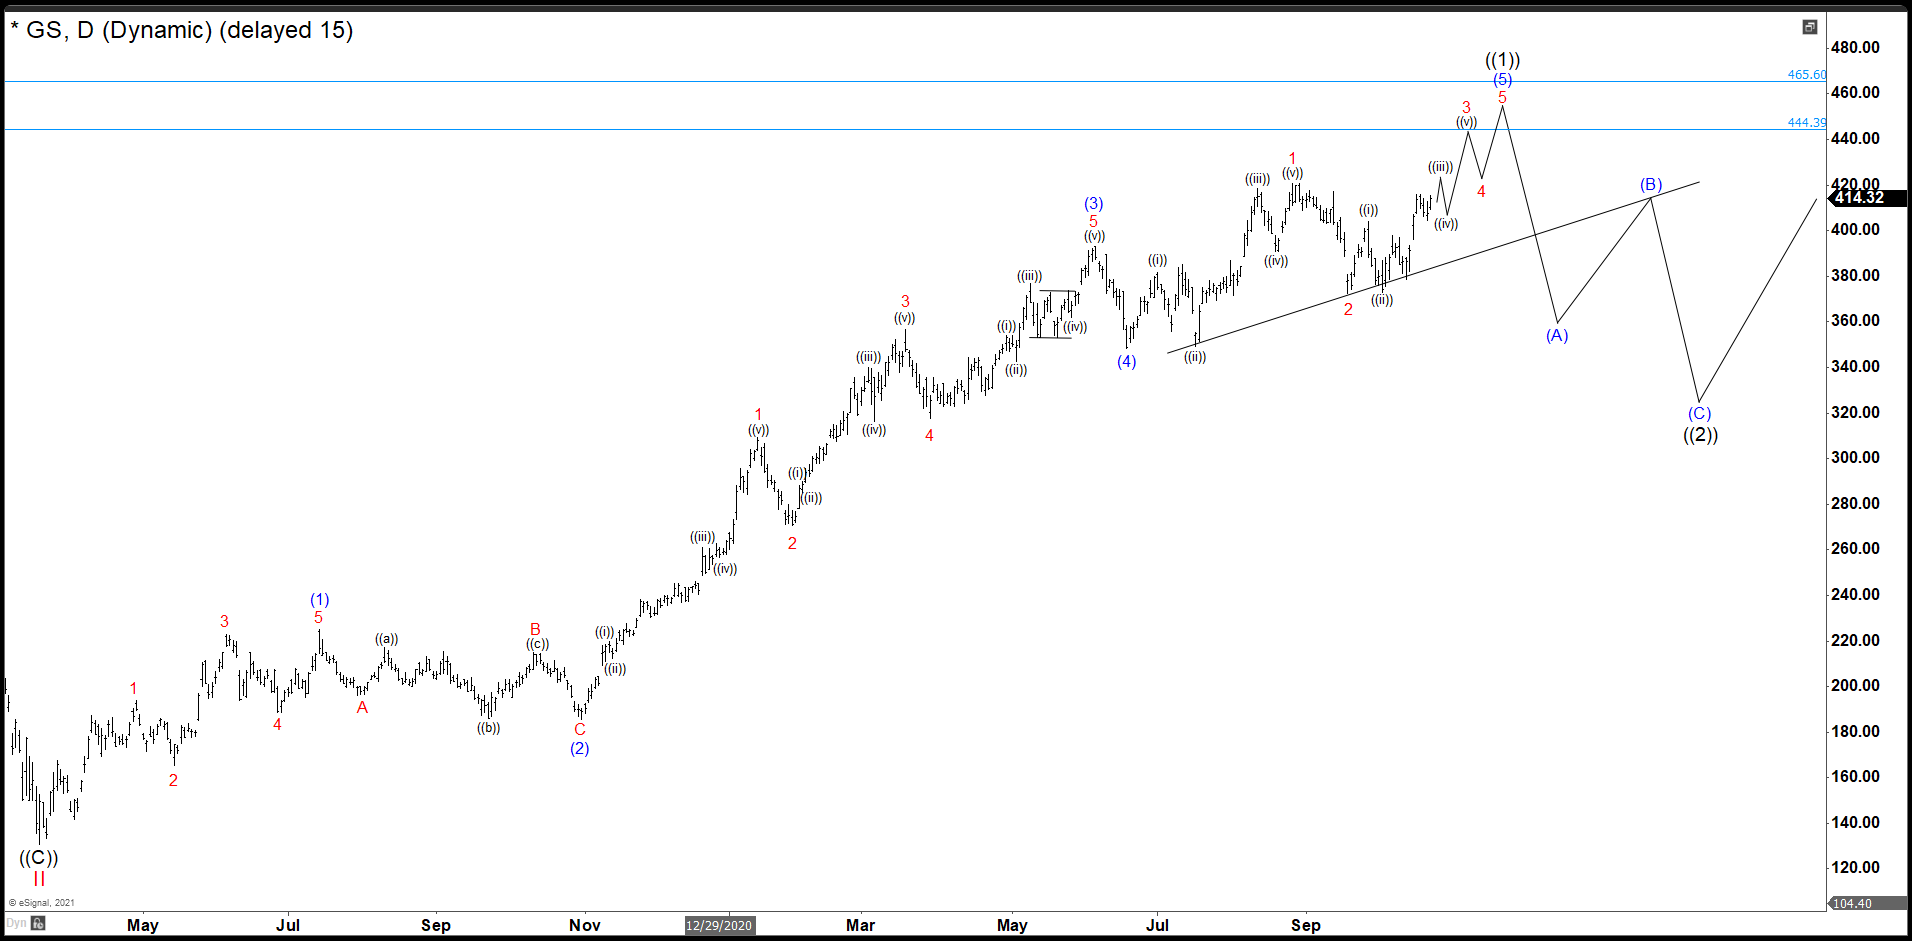
In the charts above, we can see the first wave of impulse that we called wave (1) ended at 225.24 dollars. Pullback as wave (2) end at 185.52. Then the stock rally creating 5 swings up in lesser degree to form wave (3) completed at 393.26. Wave (4) correction finished at 348.13 and from here we are still developing wave (5) in 5 waves in lesser degree.

Wave 1 of (5) in red ended at 420.73. Wave 2 correction bounce from 372.50. Wave 3 is building now which one should continue higher to 444.00 to complete wave 3. Then you must see a pullback in wave 4 and a last push to complete wave 5 of (5) and the whole motive wave as wave ((1)). We expected that impulse ((1)) finishes in 444.39 – 465.60. area and we should see a correction in the market.

Premium

You have reached your limit of 3 free articles for this month.

Start your subscription and get access to all our original articles.

Subscribe to PremiumSign In

Author

Elliott Wave Forecast Team

Elliott Wave Forecast Team

ElliottWave-Forecast.com

More from Elliott Wave Forecast Team
Share:

Editor's Picks

EUR/USD faces some resistance near 100-SMA on H4, around 1.1830 zone

The EUR/USD pair gains some follow-through positive traction for the second consecutive day and climbs to the 1.1830 region during the Asian session on Thursday. The US Dollar remains on the back foot amid concerns about the economic fallout from US President Donald Trump's erratic trade policies and acts as a tailwind for spot prices.

GBP/USD extends recovery to near 20-day EMA as US Dollar weakens

The Pound Sterling holds onto weekly gains around 1.3565 against the US Dollar during the Asian trading session on Thursday. The GBP/USD pair trades firmly as the US Dollar remains under pressure due to uncertainty surrounding the United States trade policy outlook.

Gold struggle with $5,200 extends ahead of more US-Iran talks

Gold is replicating the recovery moves seen in Wednesday’s Asian trading early Thursday, as buyers continue to flirt with the $5,200 level. Sustained US Dollar weakness and looming US-Iran talks aid the bright metal’s rebound.  

Stellar: Relief bounce fades as bearish undertone persists

Stellar is trading around $0.16 at the time of writing on Thursday after rebounding more than 8% in the previous day. Derivatives data paints a negative picture as XLM’s short bets hit a monthly high while Open Interest continues to decline.

Nvidia delivers another monster earnings report, and forecasts big things to come

It was another monster earnings report from Nvidia for fiscal Q4. Revenues were $68.1bn, smashing estimates of $65bn. Gross profit margin was a healthy 75%, up from 73.5% in the prior quarter, and the outlook for this quarter was monstrous.

Solana strikes key resistance with double-digit gains

Solana trades at $88 at press time on Thursday, after an 11% upswing the previous day within a broader consolidation range of roughly three weeks. Institutional demand for Solana heightens as US spot SOL Exchange Traded Funds record $30 million of inflow on Wednesday.