|

Gold Technical Analysis: Metal rebounds sharply from daily lows, nearing $1465/oz

  • The yellow metal erases daily losses and bounces from the November low.
  • The market is approaching the 1465 level, which is an important resistance.
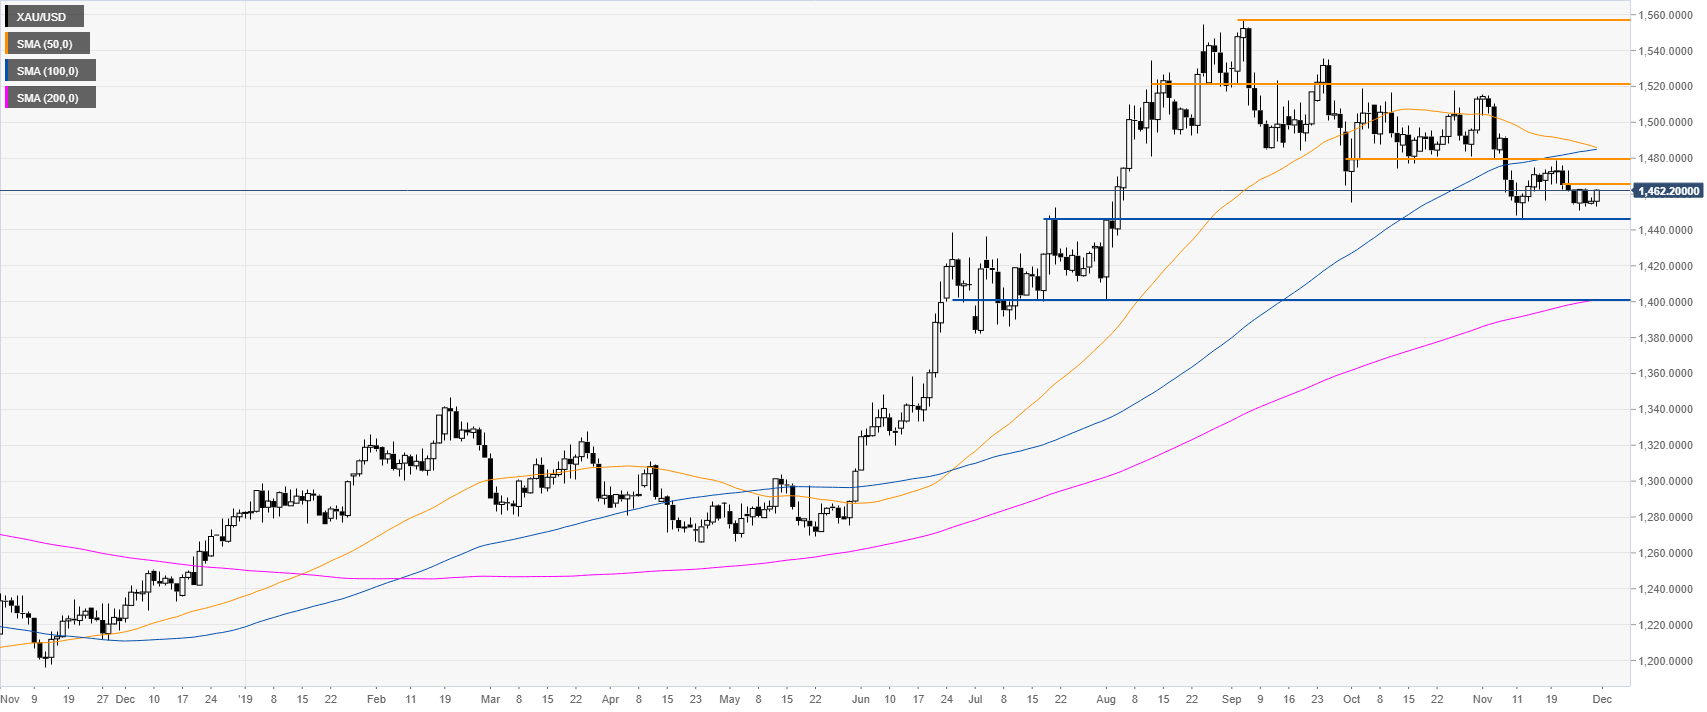
 

Gold daily chart

 
On the daily chart, gold stays under mild selling pressure near the November lows while trading below the 1465 resistance level and the 50/100 SMAs. However, the bears need a break below the 1445 swing low on a daily closing basis to drive the market towards the 1400 figure near the 200-day SMA. 
 

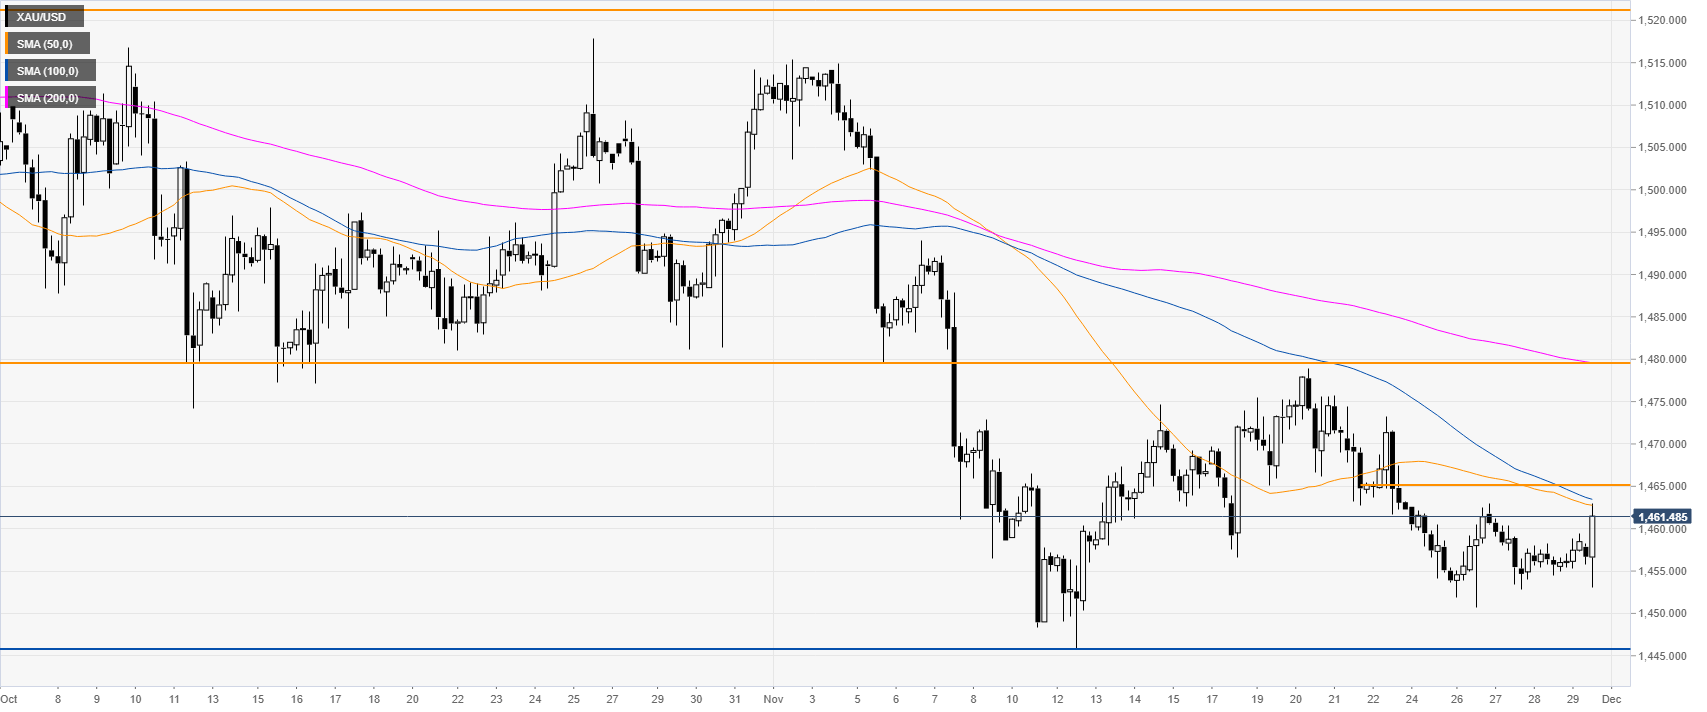
Gold four-hour chart 

 
The market is rebounding while staying below the 1465 resistance and the main SMAs. If the market fades the 1465 level then a retest of the 1445 support remains on the sellers’ radar in the medium term. 
 
Alternatively, a breakout above the 1465 level can expose the 1480 resistance on the way up. 
  

Additional key levels

EUR/USD

Overview
Today last price1.1028
Today Daily Change0.0019
Today Daily Change %0.17
Today daily open1.1009
 
Trends
Daily SMA201.1049
Daily SMA501.1041
Daily SMA1001.1078
Daily SMA2001.1167
 
Levels
Previous Daily High1.102
Previous Daily Low1.0998
Previous Weekly High1.1098
Previous Weekly Low1.1014
Previous Monthly High1.118
Previous Monthly Low1.0879
Daily Fibonacci 38.2%1.1011
Daily Fibonacci 61.8%1.1006
Daily Pivot Point S11.0998
Daily Pivot Point S21.0987
Daily Pivot Point S31.0976
Daily Pivot Point R11.102
Daily Pivot Point R21.1031
Daily Pivot Point R31.1042

Author

Flavio Tosti

Flavio Tosti

Independent Analyst


More from Flavio Tosti
Share:

Editor's Picks

EUR/USD tumbles below 1.1800 as Middle East turmoil drives US Dollar demand

The EUR/USD pair falls to near 1.1770 during the early Asian session on Monday, pressured by a renewed US Dollar demand. The Greenback gathers strength against the Euro as the conflict across the Middle East is heightening traders' anxiety, boosting the safe-haven currencies. 

GBP/USD trims losses, retests 1.3460

After briefly challenging its key 200-day SMA near 1.3440, GBP/USD now manages to regain some balance and revisit the 1.3460 zone on Friday. Cable’s pullback comes as the selling pressure on the Greenback gathers traction, reigniting some recovery in the risk-linked space.

Gold jumps over 2% toward $5,400 after US, Israel attack Iran

Gold is on fire at the start of the week, a widely expected move, as investors seek harbor in the traditional store of value, following the continued US and Israel attacks on Iran. The bright metal opened with a bullish gap of about $17 and rallied toward the $5,400 level as Asian traders hit their desks and reacted negatively to the weekend news of the Middle East conflict, rushing for cover in Gold.

Iran escalation: Quick thoughts on markets

Markets are likely to open the week with risk-off, with declines led by airlines, cyclicals and trade-exposed names, while energy, defense and “strategic” sectors may be relatively steadier.

Crisis in the Middle East: The market reaction

A primer on how markets will open on Monday, and why geopolitical risk may not be easily absorbed by financial markets this time around. Geopolitics and events between Iran, the US and the wider Middle East will dominate financial markets on Monday. The situation has continued to escalate as we move through Sunday. 

Starknet unveils strkBTC, shielded Bitcoin transactions on Ethereum Layer 2

Starknet, the Ethereum Layer 2 network developed by StarkWare, today announced strkBTC, a wrapped Bitcoin asset that introduces optional shielding while preserving full DeFi composability.