Gold Technical Analysis: Funnelling down to short-term triangle break
- Gold extends recent bounces off 38.2% Fibonacci retracement.
- A sustained upside break of the triangle can challenge the monthly high.
- The last week’s low can please sellers after the triangle’s downside break.

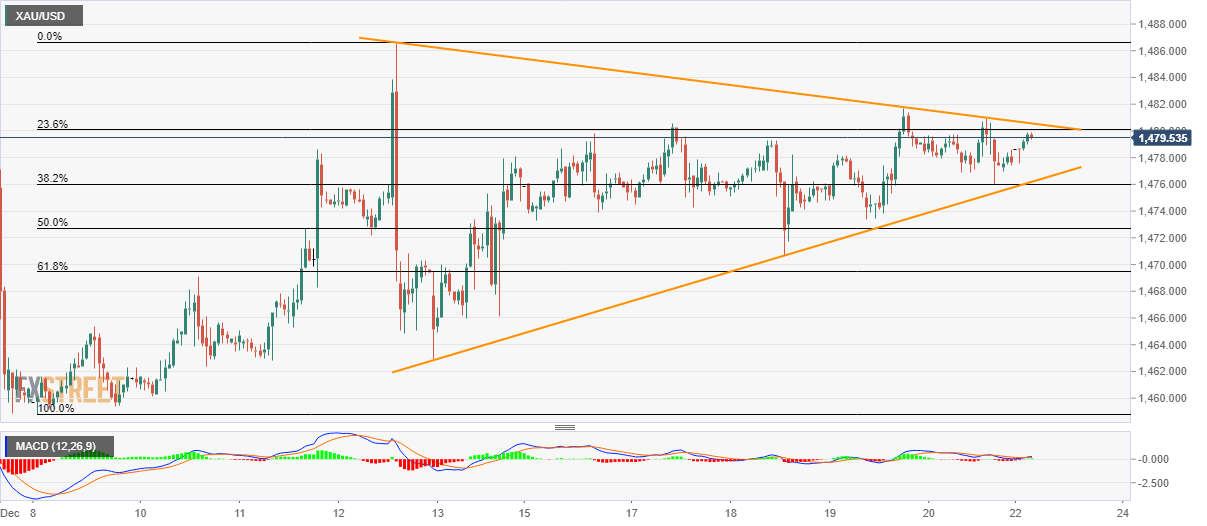
Gold prices take the bids to $1,479.75 by the press time of early Monday. The bullion is heading towards the break of short-term symmetrical triangle amid a bullish signal from 12-bar Moving Average Convergence and Divergence (MACD).
However, a sustained break of $1,480.60 is what buyers will look for ahead of targeting the monthly top near $1,487.
Should prices manage to stay strong beyond $1,487, November 06 high near $1,494 can act as an intermediate halt to $1,500 round-figure.
Meanwhile, the yellow metal’s downside break below the triangle’s support of $1,476 will fetch it to last week’s low close to $1,471,
In a case where sellers dominate below $1,471, 61.8% Fibonacci retracement of the latest upside, at $1,469, can check Bears ahead of pleasing them with December 13 low near $1,463.
Gold hourly chart
Trend: Sideways
Author

Anil Panchal
FXStreet
Anil Panchal has nearly 15 years of experience in tracking financial markets. With a keen interest in macroeconomics, Anil aptly tracks global news/updates and stays well-informed about the global financial moves and their implications.