|
Gold Technical Analysis: Bull trap
- The 15-minute chart shows gold (XAU/USD) has ended consolidation with an upside break (bullish breakout).
- However, overbought readings in relative strength index (RSI) suggests the breakout could turn into a bull trap.
- The 15-minute chart also shows a doji candle, signaling indecision despite a bullish breakout.

15-minute chart
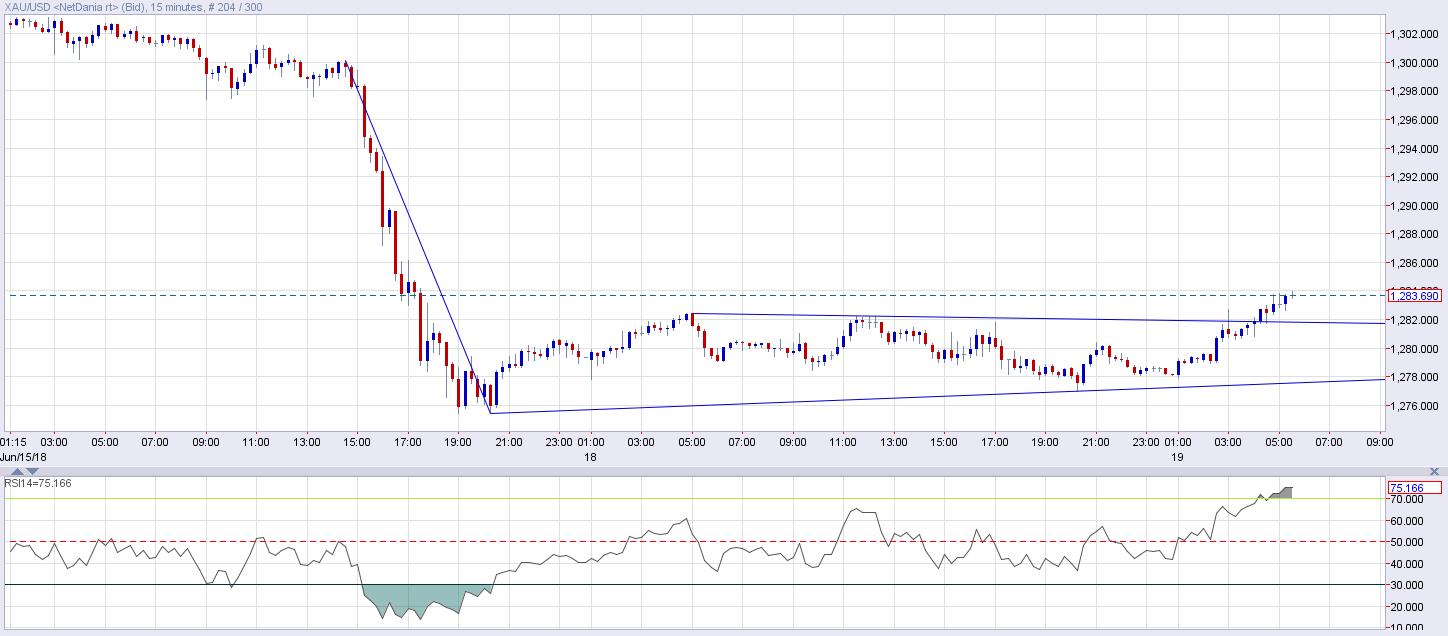
Current price: $1,283
Daily High: $1,283.81
Daily Low: $1,280.60
Trend: Bull trap
R1: $1,285 (50-hour moving average)
R2: $1,289 (5-day moving average)
R3: $1,293 (10-day moving average)
Support
S1: $1,282 (May 21 low)
S2: $1,275 (Friday's low + 100-week moving average)
S3: $1,260.59 (October 2017 low)
Author

Omkar Godbole
FXStreet Contributor
Omkar Godbole, editor and analyst, joined FXStreet after four years as a research analyst at several Indian brokerage companies.
More from Omkar Godbole


