Gold Price Forecast: XAUUSD stages a comeback, key levels to watch – Confluence Detector
- Gold Price is heading back towards $1,900 amid mixed markets.
- US dollar recovers ground but the correction doesn’t seem to be over yet.
- XAUUSD’s path of least resistance appears to the upside, for now.

Gold Price is staging a solid comeback after finding strong support near the $1,840 region over the past two trading days. The bright metal is looking to retest the two-week highs on the road to recovery, as the US dollar is struggling to recover further ground amid mixed market sentiment and subdued Treasury yields. Dismal US GDP, Markit Manufacturing PMI and Pending Home Sales point to signs of US economic slowdown, cooling off the aggressive Fed tightening expectations and keeping the dollar broadly undermined. This week’s turnaround in global stocks is also weighing on the greenback’s safe-haven appeal, benefiting the USD-priced gold.
Also read: Gold Price Forecast: Key $1,838 support could be at risk ahead of US GDP
Gold Price: Key levels to watch
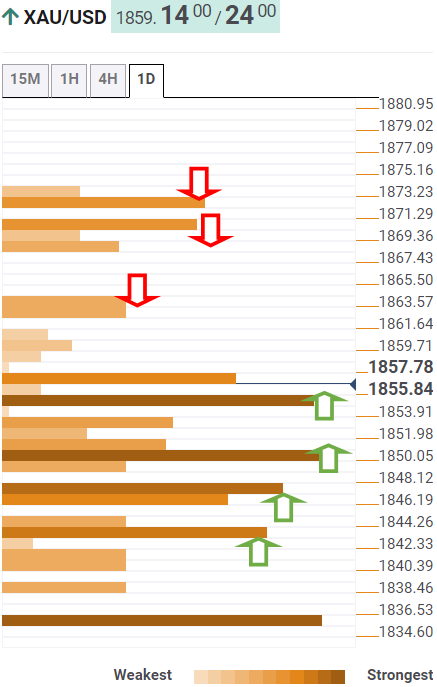
The Technical Confluences Detector shows that the Gold Price is fast approaching strong resistance at $1,863, as the renewed upside gathers steam.
That level is the convergence of the Fibonacci 161.8% one-day and the R2 daily pivot point.
The next significant upside barrier awaits at the confluence of the R3 daily pivot point, the R1 weekly pivot poi and the two-week highs at $1,870.
The previous month’s low of $1,872 will be a tough nut to crack for gold bulls.
Alternatively, the immediate downside will be capped by $1,855, which is the meeting point of the 5-day SMA and the previous day’s high.
Failure to defend the latter will threaten the $1,850 demand area, where the previous week’s high and the daily 61.8% Fibonacci merge.
Gold sellers will then target the intersection of the 100-four-hour SMA, S1 monthly pivot point and the Fibonacci 38.2% one-day at $1,847.
The last relevant support is pegged at the S1 daily pivot point at $1,844.
Here is how it looks on the tool
About Technical Confluences Detector
The TCD (Technical Confluences Detector) is a tool to locate and point out those price levels where there is a congestion of indicators, moving averages, Fibonacci levels, Pivot Points, etc. If you are a short-term trader, you will find entry points for counter-trend strategies and hunt a few points at a time. If you are a medium-to-long-term trader, this tool will allow you to know in advance the price levels where a medium-to-long-term trend may stop and rest, where to unwind positions, or where to increase your position size.
Author

Dhwani Mehta
FXStreet
Residing in Mumbai (India), Dhwani is a Senior Analyst and Manager of the Asian session at FXStreet. She has over 10 years of experience in analyzing and covering the global financial markets, with specialization in Forex and commodities markets.