Gold Price Forecast: XAUUSD rebound could extend towards $1,863, NFP awaited – Confluence Detector
- Gold Price range play intact at around $1,850 amid a cautious mood.
- The US dollar clings to gains, as inflation and Fed worries play out.
- XAU bulls could try their luck once again ahead of critical US data.

Gold Price is treading water while keeping its range around $1,850, having hit ten-day lows at $1,829 a day before. The US dollar holds onto its recent advance amid a cautious market mood, making it difficult for XAU bulls to flex their muscles. Meanwhile, the downside in the bright metal finds support from a minor pullback in the Treasury yields. However, it remains to be seen if gold price can breakout from the ongoing range trade, as inflation, geopolitics, the Fed sentiment and critical US economic data remain in play.
Also read: Where gold’s downtrend is heading
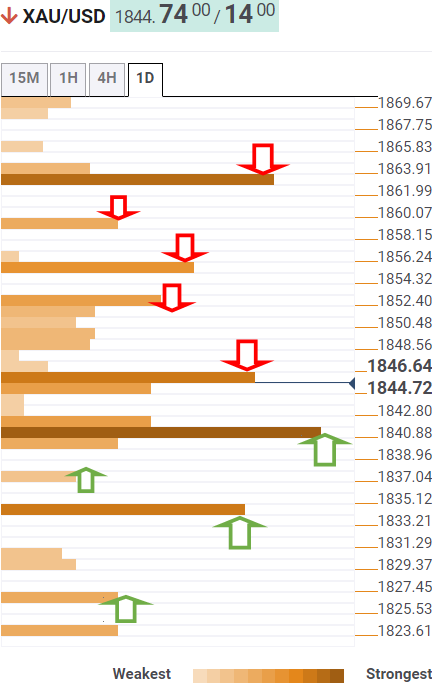
Gold Price: Key levels to watch
The Technical Confluence Detector shows that the Gold Price is challenging fierce resistance at $1,846, which is the convergence of the Fibonacci 23.6% one-day, the previous low four-hour and the Bollinger Band one-day Middle.
If bulls reclaim the abovementioned barrier, then they could march towards a dense cluster of healthy resistance levels stacked up around $1,851. That area is the meeting point of the Fibonacci 61.8% one-week, SMA50 four-hour, SMA10 one-day and the previous day’s high.
The pivot point one-day R1 at $1,855 could then test the bearish commitments on the road to recovery, above which the doors will open up for the Fibonacci 38.2% one-week.
The last line of defense for gold sellers aligns at $1,863, where the Fibonacci 61.8% one-month and the Fibonacci 23.6% one-week merge.
On the downside, the immediate cap appears at $1,840, which comprises the SMA100 four-hour, SMA200 one-day and the Fibonacci 38.2% one-day.
The next bearish target is seen at the Fibonacci 61.8% one-day at $1,837, below which the strong support around $1,834 will get tested.
At that level, the Fibonacci 38.2% one-month coincides with the pivot point one-day S1. The previous day’s low of $1,829 will be next on the sellers’ radars.
Here is how it looks on the tool
About Technical Confluences Detector
The TCD (Technical Confluences Detector) is a tool to locate and point out those price levels where there is a congestion of indicators, moving averages, Fibonacci levels, Pivot Points, etc. If you are a short-term trader, you will find entry points for counter-trend strategies and hunt a few points at a time. If you are a medium-to-long-term trader, this tool will allow you to know in advance the price levels where a medium-to-long-term trend may stop and rest, where to unwind positions, or where to increase your position size.
Author

Dhwani Mehta
FXStreet
Residing in Mumbai (India), Dhwani is a Senior Analyst and Manager of the Asian session at FXStreet. She has over 10 years of experience in analyzing and covering the global financial markets, with specialization in Forex and commodities markets.


