Gold Price Forecast: XAUUSD eyes $1,662 hurdle amid pre-NFP rebound – Confluence Detector
- Gold price remains on the front foot, printing the biggest daily gains in two weeks.
- Pre-NFP consolidation joins risk-positive headlines surrounding China to please XAUUSD bulls.
- Bulls approach the key resistance but remain unsure of crossing it amid hawkish Fed bets.

Gold price stays bid while posting the biggest daily gain, so far, in a fortnight amid the market’s cautious optimism ahead of the key US jobs report. With Friday’s strong gains, the bullion price reversed from red to green every week.
That said, the XAUUSD bulls are hopeful amid the downbeat US inflation expectations and mixed US data that weigh on the greenback. Furthermore, expectations of easing covid-led activity restrictions in China and the news suggesting early closing of the US audit inspections in China also favored the risk-on mood of late.
However, the US Treasury yields remain strong and the hawkish rhetoric from the global central banks, not only from the Fed, keeps the gold bears hopeful ahead of the all-important Nonfarm Payrolls (NFP).
Also read: Gold Price Forecast: XAUUSD appears a ‘sell the bounce trade', with US NFP ahead
Gold Price: Key levels to watch
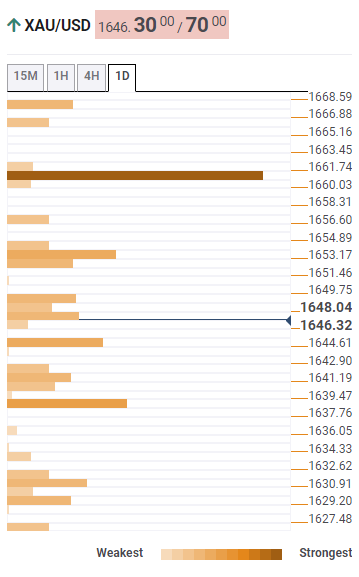
The Technical Confluence Detector shows that the gold price floats beyond small supports while approaching the key resistance surrounding $1,662 that includes Fibonacci 61.8% one-month and 200-SMA in four-hour. Also adding strength to the level is the Fibonacci 38.2% in one-month.
That said, the middle band of the Bollinger on one-day, around $1,654, seems to guard the quote’s immediate upside.
It should also be noted that the bullion’s run-up beyond $1,662 opens the door for the $1,700 threshold.
Meanwhile, sellers may wait for a clear downside break of $1,638 to retake control, comprising 50-HMA, 5-DMA and the previous weekly low.
Following that, a smooth flow toward the recent low near $1,616 can’t be ruled out.
Here is how it looks on the tool
About Technical Confluences Detector
The TCD (Technical Confluences Detector) is a tool to locate and point out those price levels where there is a congestion of indicators, moving averages, Fibonacci levels, Pivot Points, etc. If you are a short-term trader, you will find entry points for counter-trend strategies and hunt a few points at a time. If you are a medium-to-long-term trader, this tool will allow you to know in advance the price levels where a medium-to-long-term trend may stop and rest, where to unwind positions, or where to increase your position size.
Author

Anil Panchal
FXStreet
Anil Panchal has nearly 15 years of experience in tracking financial markets. With a keen interest in macroeconomics, Anil aptly tracks global news/updates and stays well-informed about the global financial moves and their implications.

















