Gold Price Forecast: XAUUSD bears eye $1,820 and $1,816 as next targets – Confluence Detector
- Gold Price rebound lacks follow-through bias, as Treasury yields firm up.
- USD stays sluggish amid a better mood, ahead of NATO, ECB Forum.
- Oil price surge keeps the demand for XAUUSD underpinned.

Optimism prevails, pointing to a turnaround Tuesday for the financial markets, as the previous week’s upbeat global momentum returns and caps the broad US dollar recovery. Investors, however, remain wary ahead of the key NATO Summit and a policy panel of the heads of the Fed, BOE and ECB due later this week. The sluggish price action in the dollar is helping Gold Price recoup a part of Monday’s sharp decline. The upside in the yellow metal lacks traction, however, as the US Treasury yields resume their gradual recovery mode amid lingering recession fears and an aggressive Fed rate-hike track. Buyers also remain cautious, as a slew of key US economic data are due for release later this week, which may prompt markets to re-price the hawkish Fed expectations, in turn impacting gold valuations.
Also read: Gold Price Forecast: Can XAUUSD bulls defend the critical $1,820 support?
Gold Price: Key levels to watch
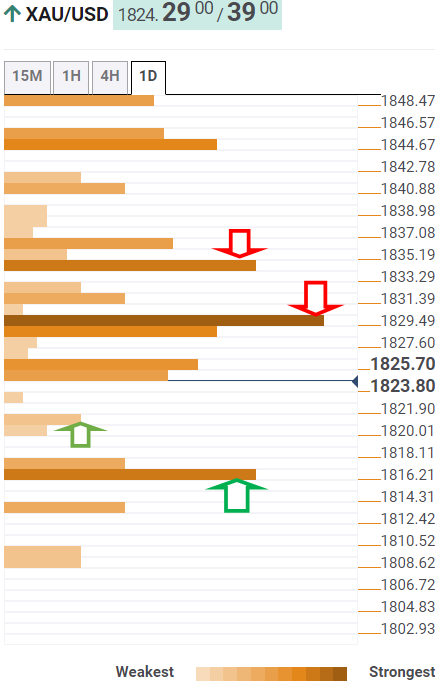
The Technical Confluence Detector shows that Gold Price is approaching the strong support around $1,820, where the previous day’s low and the lower band of the four hour Bollinger Band merge.
Selling interest may pick up steam below the latter, exposing the convergence of the previous week’s low, monthly Fibonacci 23.6% retracement and daily S1 pivot point merge at $1,816.
The line in the sand for gold optimists is seen at the weekly S1 pivot point at $1,813.
On the flip side, bulls need to find a strong foothold above the $1,829 barrier, which is the confluence of the 5-day SMA, and the daily and weekly Fibonacci 38.2% retracement level.
The next stop for bulls is aligned at the 10-day SMA at $1,832, above which the daily Fibonacci 61.8% level at $1,835 will come to sellers’ rescue.
Further up, the intersection of the weekly Fibonacci 61.8% level and the R1 daily pivot point at $1,837 will offer stiff resistance.
Here is how it looks on the tool
About Technical Confluences Detector
The TCD (Technical Confluences Detector) is a tool to locate and point out those price levels where there is a congestion of indicators, moving averages, Fibonacci levels, Pivot Points, etc. If you are a short-term trader, you will find entry points for counter-trend strategies and hunt a few points at a time. If you are a medium-to-long-term trader, this tool will allow you to know in advance the price levels where a medium-to-long-term trend may stop and rest, where to unwind positions, or where to increase your position size.
Author

Dhwani Mehta
FXStreet
Residing in Mumbai (India), Dhwani is a Senior Analyst and Manager of the Asian session at FXStreet. She has over 10 years of experience in analyzing and covering the global financial markets, with specialization in Forex and commodities markets.


