Gold Price Forecast: Can XAUUSD bulls defend the critical $1,820 support?
- Gold Price finds demand just above the critical daily support line.
- Risk-off flows propel USD higher while the Treasury yields trip.
- XAUUSD could find a brief reprieve from G7’s ban on Russian gold imports.

Gold Price is reversing a part of Monday’s losses, as bulls are rescued by the retreat in the US Treasury yields across the curve. Risk-aversion remains in vague so far this Tuesday, as investors shake off the last week’s optimism, awaiting fresh impetus from the key central bankers’ policy debate due on Wednesday. The three-day ECB Forum began on Monday, with “Challenges for monetary policy in a rapidly changing world” the main theme this year. Wednesday’s policy panel between the Fed, BOE and ECB at the Forum will be a decisive event for the bright metal direction in the coming days.
In the meantime, traders seem non-committal and refrain from placing any directional bets on the metal, as they remain cautious in anticipation of the expected ban on gold imports from Russia due to be announced later this Tuesday. Britain, the US, Japan and Canada are set to move on banning new imports of Russian gold, in an effort to squeeze Moscow’s financing means for Ukraine’s invasion. Meanwhile, the US regional manufacturing and housing indices will be reported ahead of the Conference Board (CB) Consumer Confidence data. The American data flow will be closely examined for signs of economic slowdown and the Fed’s future rate hike path. The market’s perception of risk sentiment will also play a key role in determining the dollar valuations, in turn, affecting gold price.
XAUUSD opened a new week on a positive note but failed to sustain the previous upbeat momentum after running into strong barriers near the $1,842 region. The metal shaved off the early gains and fell nearly $20 from the highest point of the day to settle Monday in the red at $1,823. The inverse correlation between the US yields and gold price came back into play, as investors remained wary whether the global central bankers will be able to skirt a recession while committing to fighting inflation. The sentiment on Wall Street was roiled, as buyers paused ahead of the key US economic data and earnings reports due for release in the week ahead.
Gold Price Chart: Daily
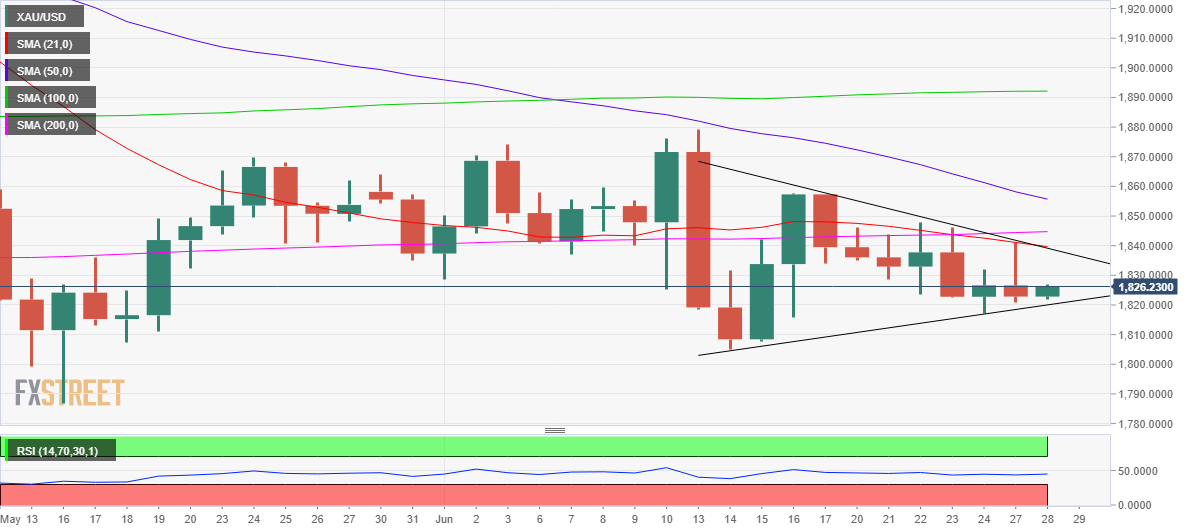
As observed on the daily chart, gold bulls are testing the bearish commitments at the critical rising trendline support at $1,820. If the latter is cracked on a daily closing basis, then it would confirm a downside break from a two-week-old pennant formation.
A fresh downtrend will kick in, with sellers targeting the $1,800 mark. Ahead of that Friday’s low of $1,1817 and the June 15 low of $1,808 could help limit the decline.
The 14-day Relative Strength Index (RSI) is trading listlessly just below the midline, keeping the selling bias intact.
Bulls need a sustained move above the $1,840 supply zone, which is the intersection of the short-tern critical 21-Daily Moving Average (DMA) and the falling trendline (triangle) resistance.
The next hurdle for buyers is seen at the mildly bullish 200 DMA at $1,845.
All in all, the path of least resistance for the commodity remains to the downside in the near term.
Premium
You have reached your limit of 3 free articles for this month.
Start your subscription and get access to all our original articles.
Author

Dhwani Mehta
FXStreet
Residing in Mumbai (India), Dhwani is a Senior Analyst and Manager of the Asian session at FXStreet. She has over 10 years of experience in analyzing and covering the global financial markets, with specialization in Forex and commodities markets.


