Gold Price Forecast: XAU/USD’s road to recovery eyes $1,940 and $1,950 – Confluence Detector


Gold price remains in the hands of buyers this Thursday, following a decent comeback amidst a hawkish Fed and worries over the Russia-Ukraine peace talks. Concerns over risks to global economic growth play out and influence gold price, in the aftermath of the Fed decision, as the focus remains on the ongoing Russia-Ukraine peace talks. The extended correction in the US Treasury yields and the dollar is lending support to gold price.

Read: Gold reversal from 2022 yearly Pivot

Gold Price: Key levels to watch

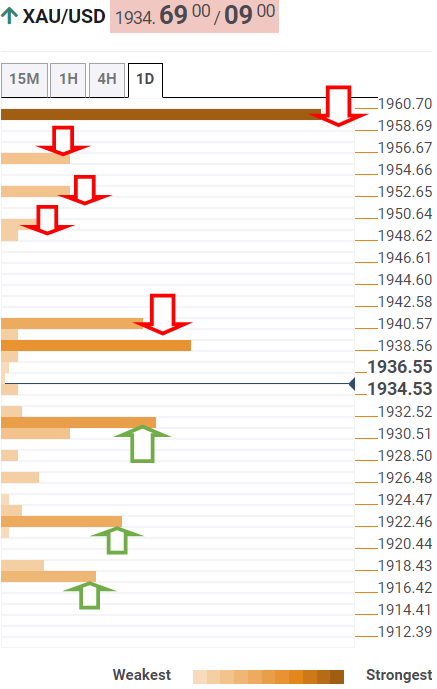
The Technical Confluences Detector shows that gold price is looking to regain the upside moment to test powerful resistance at $1,940, which is the convergence of the pivot point one-day R1, pivot point one-week S1 and Bollinger Band one-day Middle.

The next bullish target is envisioned at $1,950, which is the psychological barrier as well as the SMA100 four-hour.

Further up, the pivot point one-day R2 at $1,952 will get tested, above which the SMA5 one-day at $1,955 will be on bulls’ radars.

The confluence of the previous week’s low and the previous year’s high around $1,960 is the level to beat for gold optimists.

Alternatively, the immediate support is seen at $1,931, the intersection of the Fibonacci 23.6% one-month and the previous day’s high.

Fresh selling opportunities will arise below the latter, exposing critical support at $1,922, where the Fibonacci 23.6% one-day and SMA10 four-hour coincide.

The line in sand for gold buyers is the Fibonacci 38.2% one-day at $1,917.

Here is how it looks on the tool

fxsoriginal

About Technical Confluences Detector

The TCD (Technical Confluences Detector) is a tool to locate and point out those price levels where there is a congestion of indicators, moving averages, Fibonacci levels, Pivot Points, etc.  If you are a short-term trader, you will find entry points for counter-trend strategies and hunt a few points at a time. If you are a medium-to-long-term trader, this tool will allow you to know in advance the price levels where a medium-to-long-term trend may stop and rest, where to unwind positions, or where to increase your position size.

Share: Feed news

Information on these pages contains forward-looking statements that involve risks and uncertainties. Markets and instruments profiled on this page are for informational purposes only and should not in any way come across as a recommendation to buy or sell in these assets. You should do your own thorough research before making any investment decisions. FXStreet does not in any way guarantee that this information is free from mistakes, errors, or material misstatements. It also does not guarantee that this information is of a timely nature. Investing in Open Markets involves a great deal of risk, including the loss of all or a portion of your investment, as well as emotional distress. All risks, losses and costs associated with investing, including total loss of principal, are your responsibility. The views and opinions expressed in this article are those of the authors and do not necessarily reflect the official policy or position of FXStreet nor its advertisers. The author will not be held responsible for information that is found at the end of links posted on this page.

If not otherwise explicitly mentioned in the body of the article, at the time of writing, the author has no position in any stock mentioned in this article and no business relationship with any company mentioned. The author has not received compensation for writing this article, other than from FXStreet.

FXStreet and the author do not provide personalized recommendations. The author makes no representations as to the accuracy, completeness, or suitability of this information. FXStreet and the author will not be liable for any errors, omissions or any losses, injuries or damages arising from this information and its display or use. Errors and omissions excepted.

The author and FXStreet are not registered investment advisors and nothing in this article is intended to be investment advice.

Recommended content


Recommended content

Editors’ Picks

EUR/USD retreats toward 1.0850 on modest USD recovery

EUR/USD retreats toward 1.0850 on modest USD recovery

EUR/USD stays under modest bearish pressure and trades in negative territory at around 1.0850 after closing modestly lower on Thursday. In the absence of macroeconomic data releases, investors will continue to pay close attention to comments from Federal Reserve officials.

EUR/USD News

GBP/USD holds above 1.2650 following earlier decline

GBP/USD holds above 1.2650 following earlier decline

GBP/USD edges higher after falling to a daily low below 1.2650 in the European session on Friday. The US Dollar holds its ground following the selloff seen after April inflation data and makes it difficult for the pair to extend its rebound. Fed policymakers are scheduled to speak later in the day.

GBP/USD News

Gold climbs to multi-week highs above $2,400

Gold climbs to multi-week highs above $2,400

Gold gathered bullish momentum and touched its highest level in nearly a month above $2,400. Although the benchmark 10-year US yield holds steady at around 4.4%, the cautious market stance supports XAU/USD heading into the weekend.

Gold News

Chainlink social dominance hits six-month peak as LINK extends gains

Chainlink social dominance hits six-month peak as LINK extends gains

Chainlink (LINK) social dominance increased sharply on Friday, exceeding levels seen in the past six months, along with the token’s price rally that started on Wednesday. 

Read more

Week ahead: Flash PMIs, UK and Japan CPIs in focus – RBNZ to hold rates

Week ahead: Flash PMIs, UK and Japan CPIs in focus – RBNZ to hold rates

After cool US CPI, attention shifts to UK and Japanese inflation. Flash PMIs will be watched too amid signs of a rebound in Europe. Fed to stay in the spotlight as plethora of speakers, minutes on tap.

Read more

Forex MAJORS

Cryptocurrencies

Signatures