Gold Price Forecast: XAU/USD steadily around $1960s amid higher US bond yields
- Gold’s rise was capped by US bond yields despite concerns for a gloomy economic outlook in the US sparked by weakness in business activity.
- The US Federal Reserve is expected to maintain interest rates unchanged at the June reunion, but recent central bank decisions worldwide suggest tightening monetary conditions loom.
- Technical analysis of XAU/USD suggests a potential inverse head-and-shoulders pattern, with a crucial resistance confluence of the 50 and 20-day EMAs to validate it.

Gold price retreats after hitting a daily high of $1966.34 as US bond yields edge higher, a headwind for the yellow metal. Investors sentiment is negative after reports of business activity in the United States (US) raised worries about a recession, underpinned the US Dollar (USD) by last week’s Federal Reserve (Fed) dovish comments, cushioned XAU/USD fall. At the time of writing, XAU/USD is trading at $1959.40, with losses of 0.10%.
Investor sentiment cools Gold’s rally as increasing US bond yields and signs of persistent inflation pressure the precious metal.
Sentiment improvement keeps the Gold price pressured. After dropping sharply on Monday, US Treasury bond yields recover, with the 10-year note rate at 3.708%, two basis points higher than the open, while US 10-year TIPS, a proxy for real yields, are at 1.521%, above the 1.50% mark, after Monday’s close below the latter.
Gold witnessed an increase in flows after the Institute for Supply Management’s (ISM) May figures for manufacturing and services painted a gloomy scenario in the United States (US). Even though the US jobs report was outstanding, with May Nonfarm Payrolls printing 339K jobs added to the economy, the Unemployment Rate advancing 0.3% to 3.7%, eased the Fed’s job of tackling stubbornly sticky inflation. That triggered a jump in US bond yields as investors disregarded a possible rate hike in June.
Traders expect a 76% chance that the US Federal Reserve would keep rates unchanged at the June 13-14 reunion, as shown by the CME Fed Watch Tool. Nevertheless, it should be noted that some central banks that paused rate hikes earlier re-engaged toward tightening monetary conditions as inflation proves to be persistent.
Amongst those, the latest surprise happened Tuesday early in the Asian session, with the Reserve Bank of Australia (RBA) lifting rates for the second straight meeting. Gold traders should remember that the RBAs skipped a meeting, just to witness a jump in inflation and wages. After that, 50 bps of tightening had been added to its cash rate, now at 4.10%.
On Wednesday’s Bank of Canada (BoC) decision, which also paused its tightening cycle but sounded more hawkish than expected on the latest meeting. TDS analysts noted, “We look for the BoC to hike by 25bp in June and 25bp in July. Ongoing economic resilience will lengthen the path back to 2.0% inflation, and as such, we believe the BoC needs to tighten further.” Furthermore, “Recent data have cleared the bar to additional hikes.”
Given the backdrop, we will see what the Federal Reserve decides the next week, but current central bank decisions could delineate what the Fed could do.
XAU/USD Price Analysis: Technical outlook
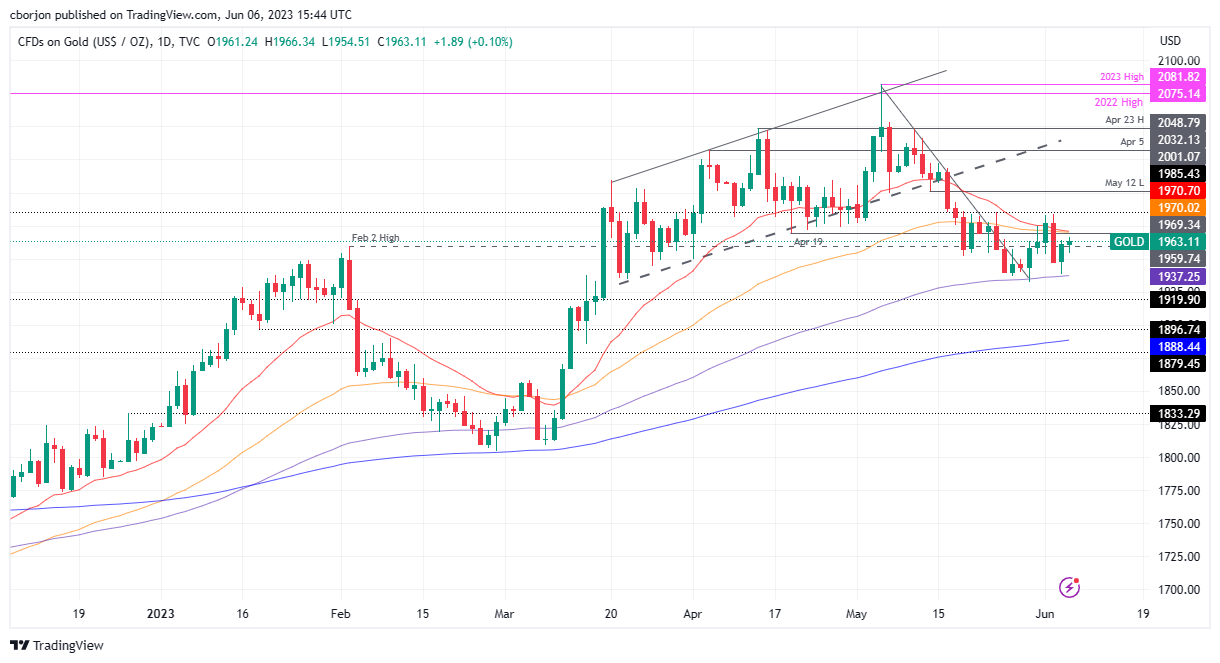
XAU/USD daily chart suggests the yellow metal is trading sideways, but an inverse head-and-shoulders could be forming. However, to validate the chart pattern, XAU/USD must rally past the confluence of the 50 and 20-day Exponential Moving Averages (EMAs) at $1969.90 and $1970.41, respectively. Once cleared, that would pave the way for the last week’s high of $1983.44, before aiming toward the May 12 low-shifted resistance at $1985.43, on XAU’s path toward the $2000 mark. Conversely, the pattern would be negated if XAU/USD tumbles below the 100-day EMA at $1937.19, followed by the May 30 daily low of $1932.20.
Author

Christian Borjon Valencia
FXStreet
Markets analyst, news editor, and trading instructor with over 14 years of experience across FX, commodities, US equity indices, and global macro markets.


