|

Gold Price Forecast: XAU/USD sinks below $2,000 as US PMIs improve and recession fears fade

  • Gold price dives on a surprisingly positive US S&P Global PMIs.
  • Improvement in business activity in the US bolstered the US Dollar.
  • The US Federal Reserve is expected to hike rates by 25 bps at the May meeting – FedWatch Tool.
Gold Price Forecast: XAU/USD sinks below $2,000 as US PMIs improve and recession fears fade

Gold price plunges below $2,000 and hit a daily low of $1,971.74 after the release of economic data from the United States (US) showed that the economy continues to expand, despite recent reports flashing a recession. Therefore, XAU/USD is trading at $1,982.78, losses 1.07%, at the time of writing.

US business activity picked up, Gold tumbles

S&P Global reported the final PMI readings for the US, which surprised most investors, which were caught off guard, as shown by the market’s reaction. The S&P Global Manufacturing PMI was 50.4, above 49 estimates, while the Services rose to 53.7, exceeding the consensus of 51.5. Therefore, the Composite reading was 53.5, above its previous reading.

As a result, XAU/USD spiked to $1,997.95 before tanking toward a two-day low of $1971.30, $1.5 above the S3 daily pivot point and shy of testing the weekly low of $1,968.80. Conversely, US Treasury bond yields climbed,  as the report signals that inflation could rise, with 2s and 10s, gaining each three basis points, at 4.184% and 3.564%, respectively.

In the meantime, the CME FedWatch Tool, which forecasts the next move of the US Federal Reserve (Fed), keeps odds at 88% for a 25 bps rate hike at the May 2-3 meeting. Hence, the greenback is pairing some of its Thursday’s losses, as shown by the US Dollar Index (DXY), which tracks the buck’s performance vs. six peers, up at 0.14% at 101.936.

On Thursday, Federal Reserve officials crossed newswires. Philadelphia Fed President Patrick Harker suggested the US central bank is close to ending its campaign to control inflation. At the same time, Cleveland’s Loretta Mester believes rates should go above 5% due to high inflation. The current benchmark rate is between 4.75% and 5%.

Next on the agenda, the Federal Reserve Governor Lisa Cook will cross newswires ahead of the media blackout that Fed officials would begin, ending with the Fed Chair Powell press conference on May 3.

XAU/USD Technical Analysis
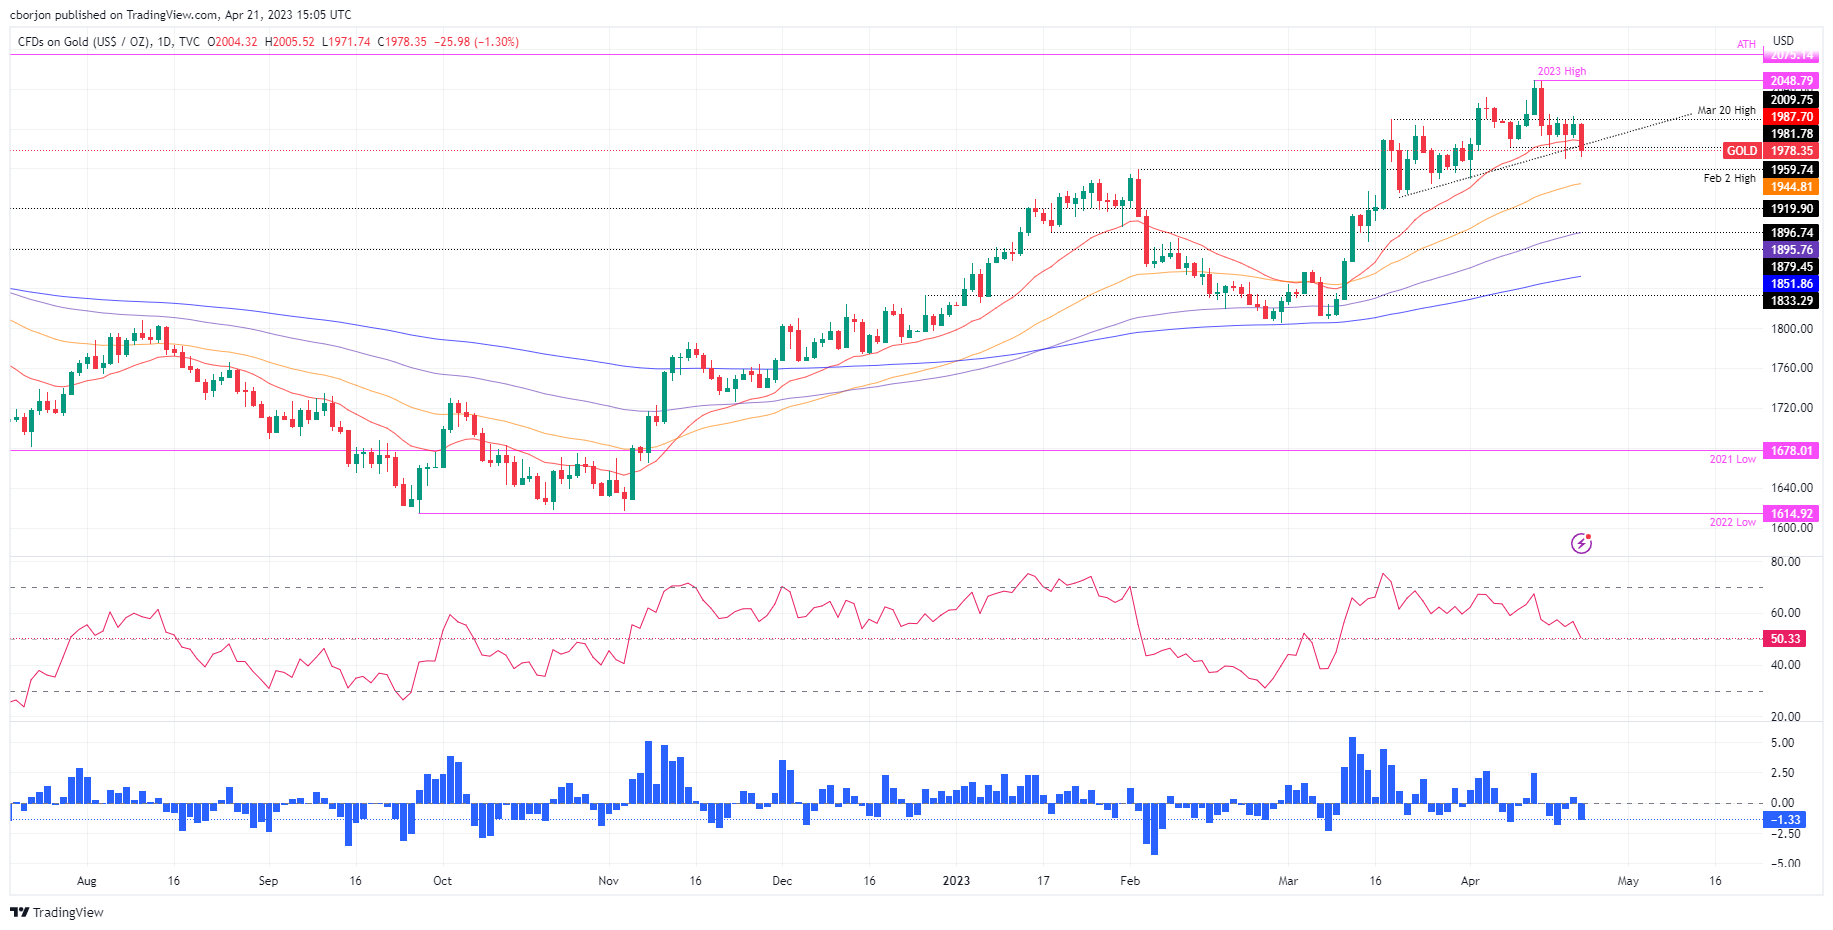
XAU/USD Daily Chart

From a technical perspective, Gold finally broke below the 20-day Exponential Moving Average (EMA) at 1988.01, which could pave the way for further downside. It should be said the 20-day EMA has been dynamic support for Gold buyers, meaning that sellers must keep prices below $1,988. If XAU/USD sellers want to cement their case, a break below the weekly low of $1,969.34 could keep them on the path toward the $1,950 area before testing the 50-day EMA at $1,944.87. Otherwise, XAU’s buyers, once reclaiming $1,990, could pave the way for a retest of $2,000.

XAU/USD

Overview
Today last price1978.93
Today Daily Change-25.87
Today Daily Change %-1.29
Today daily open2004.8
 
Trends
Daily SMA201995.18
Daily SMA501917.47
Daily SMA1001885.31
Daily SMA2001799.01
 
Levels
Previous Daily High2012.44
Previous Daily Low1990.56
Previous Weekly High2048.75
Previous Weekly Low1986.28
Previous Monthly High2009.88
Previous Monthly Low1809.46
Daily Fibonacci 38.2%2004.08
Daily Fibonacci 61.8%1998.92
Daily Pivot Point S11992.76
Daily Pivot Point S21980.72
Daily Pivot Point S31970.88
Daily Pivot Point R12014.64
Daily Pivot Point R22024.48
Daily Pivot Point R32036.52

Author

Christian Borjon Valencia

Markets analyst, news editor, and trading instructor with over 14 years of experience across FX, commodities, US equity indices, and global macro markets.


More from Christian Borjon Valencia
Share:

Editor's Picks

AUD/USD stays vulnerable below 0.6800 after weak China data

AUD/USD kicks off the week subdued, consolidating recent heavy losses to its lowest level since January. The pair stays defensive below 0.6800 after China’s October Retail Sales and Industrial Production disappointed, keeping the Chinese proxy, the Australian Dollar, undermined amid a broadly bullish US Dollar and fresh US-Iran tensions.

USD/JPY drifts toward 159.50 despite dismal Japan Q3 GDP

USD/JPY faces headwinds and drifts lower toward 159.50 at the start of the new week on Monday, shrugging off dismal data showing that Japan’s economy unexpectedly shrank by 0.1% in Q3. Japanese Yen draws support from looming intervention risks. Meanwhile, the US Dollar sits near a 19-month high amid certainty of a Fed rate hike and geopolitical risks, supporting the pair.


Gold trims losses; still below $3,900

Gold now manages to regain some composure, trimming part of earlier losses and refocusing on the $3,900 region per troy ounce on Monday. The continuation of the upside momentum in the US Dollar and investors’ repricing of further Fed tightening keep the yellow metal under scrutiny, although declining US Treasury yields and the correction in crude oil prices appear to lend some support to bullion.

Crypto Today: Bitcoin, Ethereum, XRP face increasing selling pressure, ETF outflows

Bitcoin trades lower below $65,000 on Monday, as selling pressure expands in the broader cryptocurrency market, accentuated by growing risk-off sentiment. Ethereum paints a similar grim picture, with the price sliding near $1,800 while Ripple remains below $0.95.

Nvidia earnings preview: The first big test after Jensen Huang’s exit

Nvidia reports on 17 November after the US close, with consensus pointing to roughly US$109 billion in revenue and adjusted earnings of US$2.47 per share. Strong earnings could support sentiment, but uncertainty remains: Leadership clarity may ease some concerns.

Gold hit its lowest level of 2026 near $3,850
Gold (XAU/USD) attempts to stabilize around $3,890 on Friday after falling to $3,852 on Thursday, its lowest level since October 2025. The precious metal has lost more than 4% this week, as investors increasingly anticipate further monetary tightening from the Federal Reserve (Fed). The latest decline reflects a sharp change in market expectations.