Gold Price Forecast: XAU/USD drops to $1,735 area amid surging US bond yields
- Gold picks up bids inside short-term trading range below short-term SMA, trend line resistance.
- Market sentiment dwindles as PBOC battles Evergrande woes, Fedspeak favor tapering.
- Economic recovery hopes linger in Asia but the West stays optimistic.
- Gold Price Forecast: Bulls not interested

Update: Gold witnessed fresh selling during the early European session and dropped to the $1,735 area or the lowest level since August 11 in the last hour. The latest leg of the decline over the past hour or so could be attributed to a sudden spike in the US Treasury bond yields, which tend to drive flows away from the non-yielding yellow metal. The US bond yields have been moving higher after the Fed hinted that it will soon taper its asset purchases and the so-called dot plot showed policymakers' inclination to raise interest rates in 2022.
In fact, the yield on the benchmark 10-year US government bond shot to the highest level since June 17, around 1.544%. Apart from this, the repricing of the likely timing of the Fed's policy tightening pushed the US dollar to over one month tops. This was seen as another factor that weighed on the dollar-denominated gold. That said, a cautious mood around the equity markets – amid worries about China Evergrande Group's unsolved debt crisis – could lend some support to the safe-haven XAU/USD and help limit deeper losses.
Previous update: Gold (XAU/USD) stays sidelined around $1,750, recently picking up bids to $1,751 ahead of Tuesday’s European session. The yellow metal has been range-bound since the week start as traders struggle for clear direction mixed catalysts.
On the positive side, the People’s Bank of China (PBOC) battles the Evergrande woes and keeps the market players hopeful of overcoming the threat to the world’s second-largest economy.
The hopes of US stimulus and chatters over removing the virus-led activity restrictions also underpin the risk-on mood, favoring gold prices.
Furthermore, central banks from Eurozone and the US are optimistic as well, which in turn favor the market sentiment.
However, anxiety over the US debt limit extension before the October 01 expiry and economic fears emanating from China question the optimists. Recently, the World Bank hints at the slower economic growth in East Asia and the Pacific.
On the same line were pessimism surrounding China’s power cut and Brexit woes, not to forget firmer US Treasury yields that keep the US Dollar Index (DXY) on the front foot and weigh on the gold prices.
Hence, traders mixed concerns ahead of Fed Chair Jerome Powell’s testimony and ECB President Lagarde’s additional comments keep gold traders clueless. Also important is the monthly print of the US Conference Board’s Consumer Confidence figures for August. Above all, risk catalysts are more important, especially from China.
Read: Conference Board Consumer Confidence Preview: Unhappy but still spending
Technical analysis
Gold fades bounce off seven-week-old horizontal support, flashing a bearish Doji candlestick the previous day.
Also keeping the sellers hopeful is the commodity’s trading below 10-DMA and a descending resistance line from September 03, respectively around $1,760 and $1,773.
Additionally challenging the gold buyers is a horizontal line from late August surrounding $1,780.
Meanwhile, a downside break of the stated nearby support of $1,738 needs validation from August 10 low surrounding $1,717 to recall the gold bears targeting the $1,700 threshold, a well as the yearly bottom of $1,687.
Gold: Daily chart
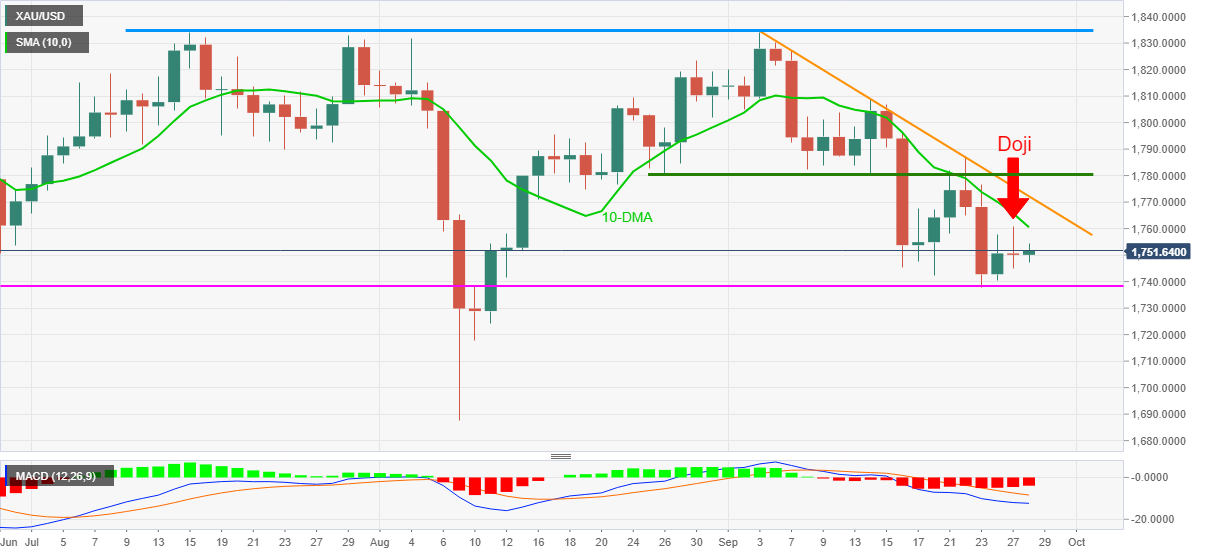
Trend: Further weakness expected
Author

Anil Panchal
FXStreet
Anil Panchal has nearly 15 years of experience in tracking financial markets. With a keen interest in macroeconomics, Anil aptly tracks global news/updates and stays well-informed about the global financial moves and their implications.