Gold Price (XAUUSD) rebounds towards $1,850 as DXY eases ahead of US inflation
- Gold price manages to consolidate losses at three-month low ahead of the key US inflation data.
- Mixed sentiment, DXY pullback recall buyers but Fedspeak, growth fears weigh on prices.
- 12-day-old megaphone formation, weekly resistance line also keep sellers hopeful even as softer US CPI can extend price recovery.

Gold Price is looking to extend its recovery from three-month lows of $1,836 in the European session, as it recaptures the psychological $1,850 barrier ahead of the critical US inflation data.
The recovery momentum in XAU/USD strengthens, as the US dollar index extends its pullback from above the 104.00 level, undermined by the relief rally seen across the global markets.
China’s Consumer Price Index (CPI) rose past 1.8% market consensus to 2.1% YoY whereas the Producer Price Index (PPI) crossed 7.7% expectations with the 8.0% yearly figures. As China is among the world’s top gold consumers, firmer inflation despite the coronavirus-led lockdowns underpins the hopes of the dragon nation’s future demand for the yellow metal.
Also favoring the prices could be headlines from Shanghai local authorities that mentioned no virus spread in eight districts.
On the same line were early Asian session comments from Atlanta Fed President Raphael Bostic who mentioned that the US economy is strong and demand is high while also expecting the neutral rate at 2.0-2.5%.
Even so, Cleveland Fed President and FOMC member Loretta Mester recalled the market bears as she said, “They don't rule out a 75 basis points rate hike forever”.
Also challenging the gold buyers is China’s “Zero Covid Tolerance” policy despite the World Health Organization’s (WHO) push to ease the rigid activity restrictions in Shanghai and Beijing. The lockdowns in the world’s largest industrial player pose a serious threat to global growth, especially at a time when inflation fears are high.
Elsewhere, the tales of the Russia-Ukraine war and its likely negative implications also keep gold sellers hopeful. As per the latest updates, Europe needs to divert its gas flow from Russia which previously used to arrive via Ukraine.
Amid these plays, the US 10-yer Treasury yields and the US Dollar Index (DXY) remain pressured around 2.99% whereas the S&P 500 Futures print mild gains near the 4,000 level after a mixed closing on Wall Street.
Looking forward, the US CPI is expected to ease to 8.1% from 8.5%, and will be important to watch for fresh impulses. However, a major focus will be on the US Consumer Price Index ex Food & Energy figures which are likely to ease to 6.0% YoY versus 6.5% prior. Should the inflation figures refrain from easing for April, the US dollar will witness magnified buying, which in turn will drag XAU/USD towards a fresh multi-month low.
Also read: Gold price targets $1,830 regions
Technical analysis
Gold price remains pressured inside a bearish megaphone chart formation, despite the latest rebound, suggesting a further widening of downside moves.
That said, the metal’s break of the $1,850 horizontal support eyes 61.8% Fibonacci Expansion (FE) of April 19 to May 05 moves, around $1,828. However, the RSI (14) approaches oversold territory, indicating that the bears are running out of steam.
Should gold price drops below $1,828, the support line of the megaphone, around $1,810, will lure the sellers.
Meanwhile, the weekly resistance line limits immediate recovery around $1,858, a break of which could propel the bullion towards the $1,900 threshold, coinciding with the megaphone’s upper line.
It’s worth observing that the 200-SMA, around $1,923, appears a tough nut to crack for the gold buyers afterward.
Gold price: Four-hour chart
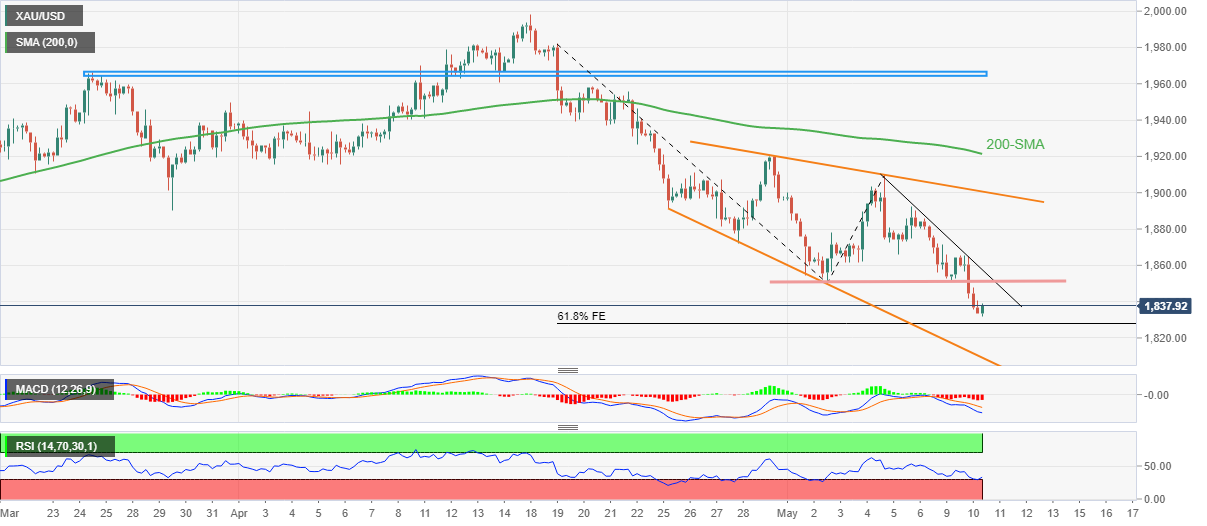
Trend: Bearish
Spot silver (XAG/USD) prices have fallen back sharply from earlier session highs in the upper $21.00s per troy ounce and are now back to trading back under the $21.50. At current levels in the $21.40s, on-the-day gains have now been pared to about 1.0%. Just released US Consumer Price Index data showed a slower than expected moderation in the YoY rate of headline price pressures and a larger than expected jump in MoM Core price pressures in April.
The US dollar and US yields jumped as a result and this explains the recent pullback in XAG/USD. Some traders had been hoping for a moderation in inflation pressures to ease the pressure on the Fed to tighten monetary policy so aggressive this year and next. The latest data certainly doesn’t do that, hence the rebuilding of some hawkish Fed bets.
Author

Anil Panchal
FXStreet
Anil Panchal has nearly 15 years of experience in tracking financial markets. With a keen interest in macroeconomics, Anil aptly tracks global news/updates and stays well-informed about the global financial moves and their implications.


