Gold Price Forecast: XAU/USD hovers around fortnight high above $1,800 amid market’s indecision
- For gold's next move, all eyes turn to the US dollar and CPI later this week.
- CTA trend followers could add to outflows should prices close below $1800/oz.

Update: Gold (XAU/USD) bulls take a breather around $1,826 as Asian traders roll up their sleeves for Wednesday’s work, after witnessing a three-day uptrend. In doing so, the precious metal stays near the fortnight light flashed the previous day amid broadly weaker US dollar, also ignoring the 39-month high US 10-year Treasury yields.
Despite posting mild daily gains, the US Dollar Index (DXY) remains sluggish around the mid-January levels as market players keenly await the US Consumer Price Index (CPI) data, up for publishing Friday.
The cautious mood joins trade and political fears emanating from China and Russia respectively but fails to tame Wall Street gains, which in turn underpinned the rush for the traditional safe-haven gold.
Moving on, Fedspeak and risk catalysts may offer intermediate clues to entertain gold traders but Thursday’s US CPI will be closely observed as a hot number will propel 0.50% Fed rate-hike concerns and may work as a negative for the bright metal if the US dollar extends the latest rebound.
End of update.

At $1,827, gold, XAU/USD is higher on the day by 0.40%. The price has moved from a low of $1,815.49 to reach a high of $1,828.40 so far. Overall, it's a slow start to the week and there is a lack of volatility on the forex space which means the US dollar is stuck around opening levels for the week as traders await key inflation data on Thursday.
However, benchmark US 10-year Treasury yields are pushing up key technical levels which, if broken, could send the yields over the key psychological threshold of 2% this week. This is supporting the greenback on Tuesday. DXY is over 0.2% higher, which is an index that measures the US dollar vs. a basket of rival major currencies. The index has ranged between 95.398 and 95.75.
Looking ahead, with gold at a critical juncture, as illustrated on the charts below, analysts at TD Securities explain, that at first glance, 'the set-up is in gold ripe for another position squeeze, as several participants including TD Securities have established tactical short gold positions.
They explained that this is following the decisively hawkish Fed meeting, only to find substantial volume on the bid keeping prices from breaking below their bull-market-era trendline support. ''This time'', they argue, however, ''the bar is high for a substantial squeeze, suggesting macro headwinds will ultimately weigh on gold.''
''. It remains to be seen whether central bank purchases might be playing a substantial role in keeping gold prices from breaking lower, but shorts are unlikely to feel much pain as the data continues to point to little speculative interest for the yellow metal. Conversely, CTA trend followers could add to outflows should prices close below $1800/oz.''
Gold technical analysis
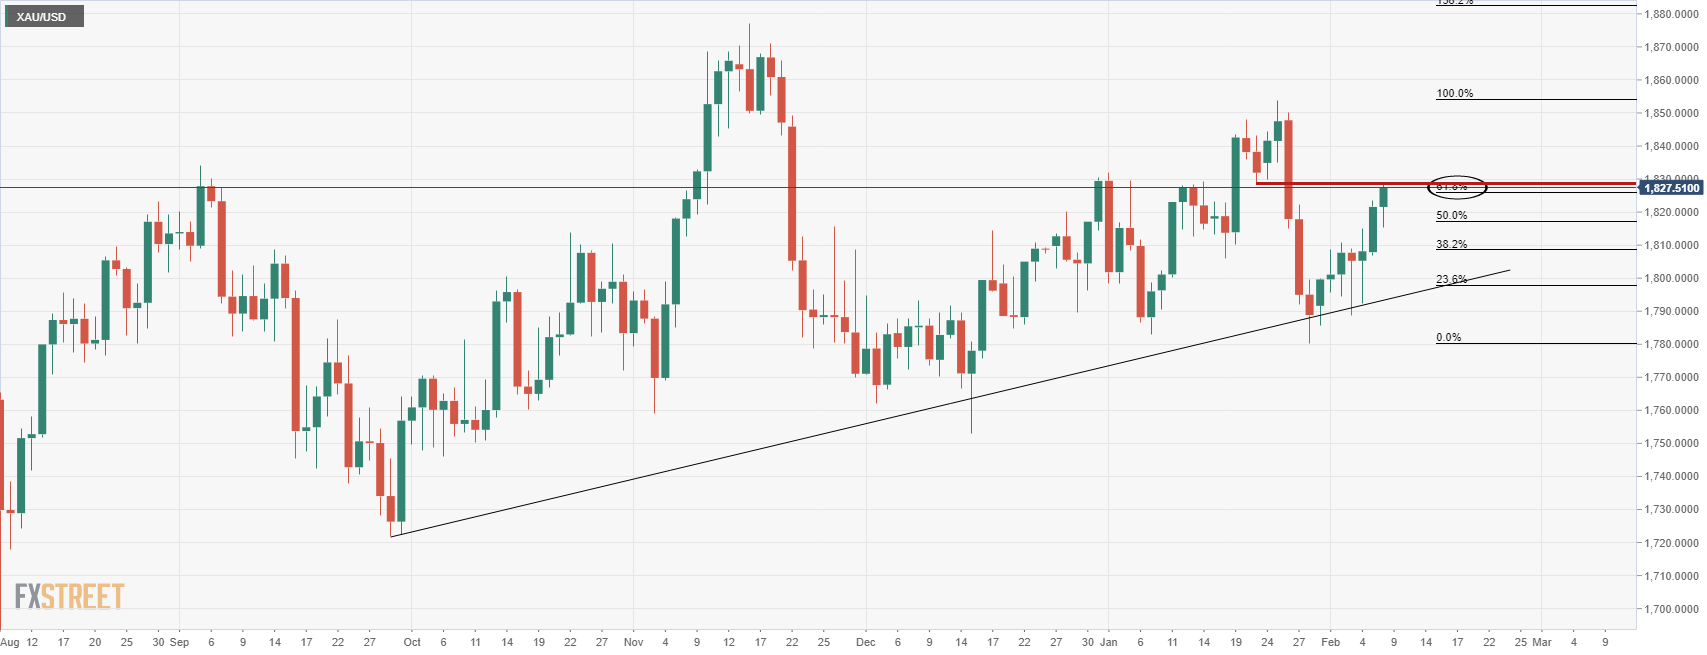
As per the prior analysis, and this week's, Gold, Chart of the Week: Bulls take on the 38.2% Fibo, now eye the 61.8% golden ratio, the price has finally moved on the 61.8% ratio as follows:
Gold, prior analysis
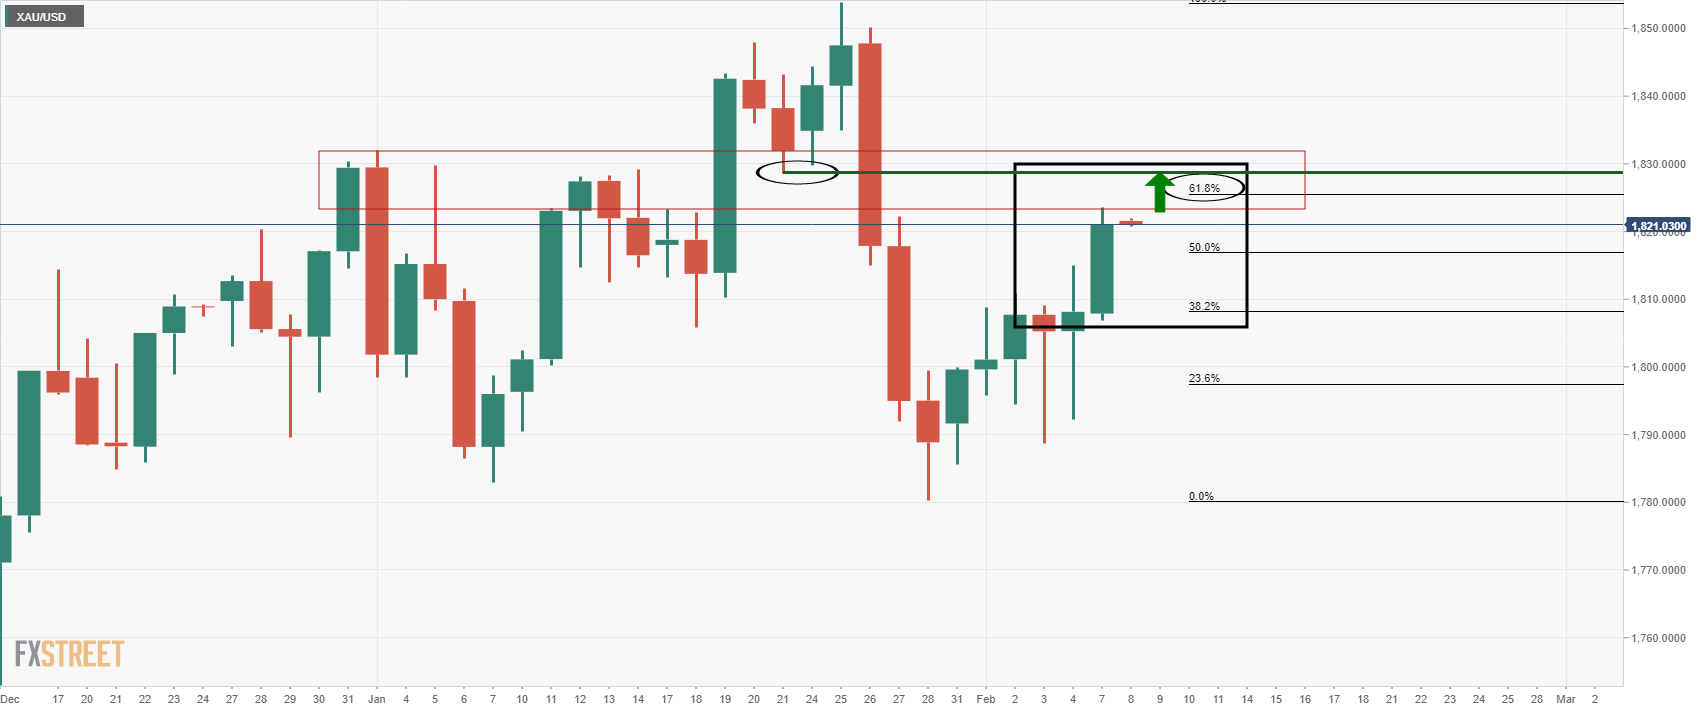
''While there are no direct confluences at a specific price target between the neckline of the M-formation and the 61.8% ratio, the area between the two mile-stones near $1,830 will be expected to offer firm resistance.''
Gold live market
As illustrated, the bulls have moved in on the 61.8% ratio. What now?
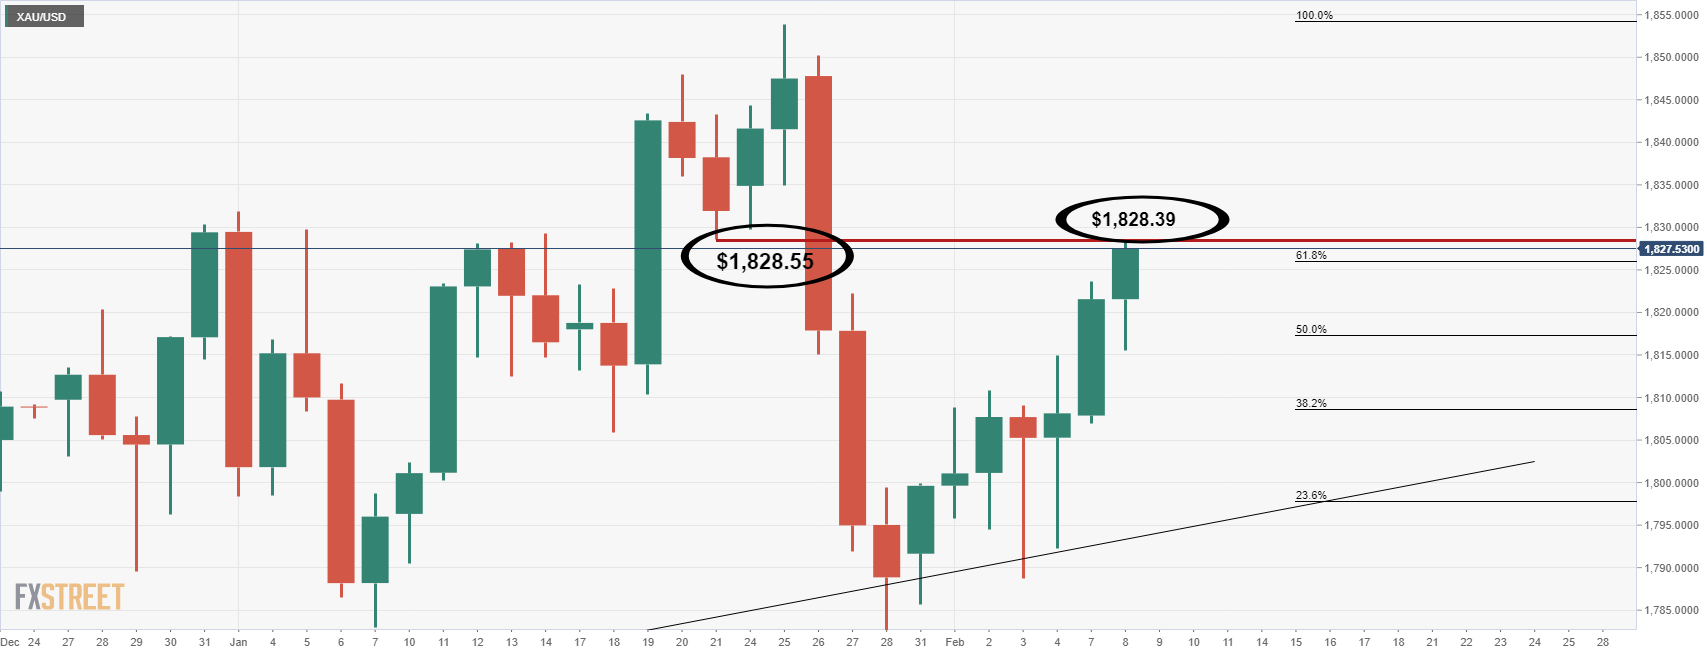
In the chart below, we see that the price has reached the neckline of the M-formation to the rounded down $1,828. This matters because this is an area of liquidity that could lead to supply entering the market which would typically cap the price. This leaves the focus on the downside which leaves the $1,811 vulnerable:
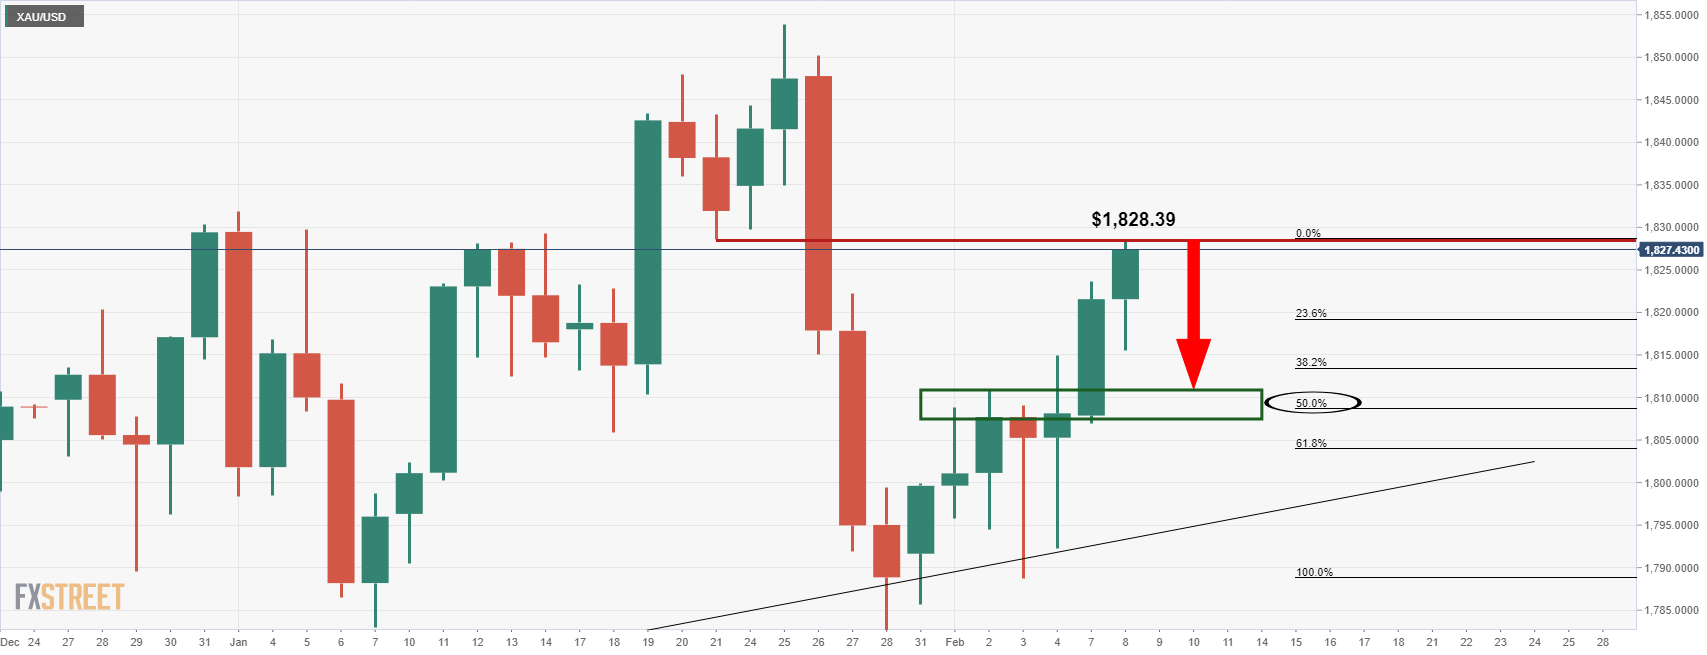
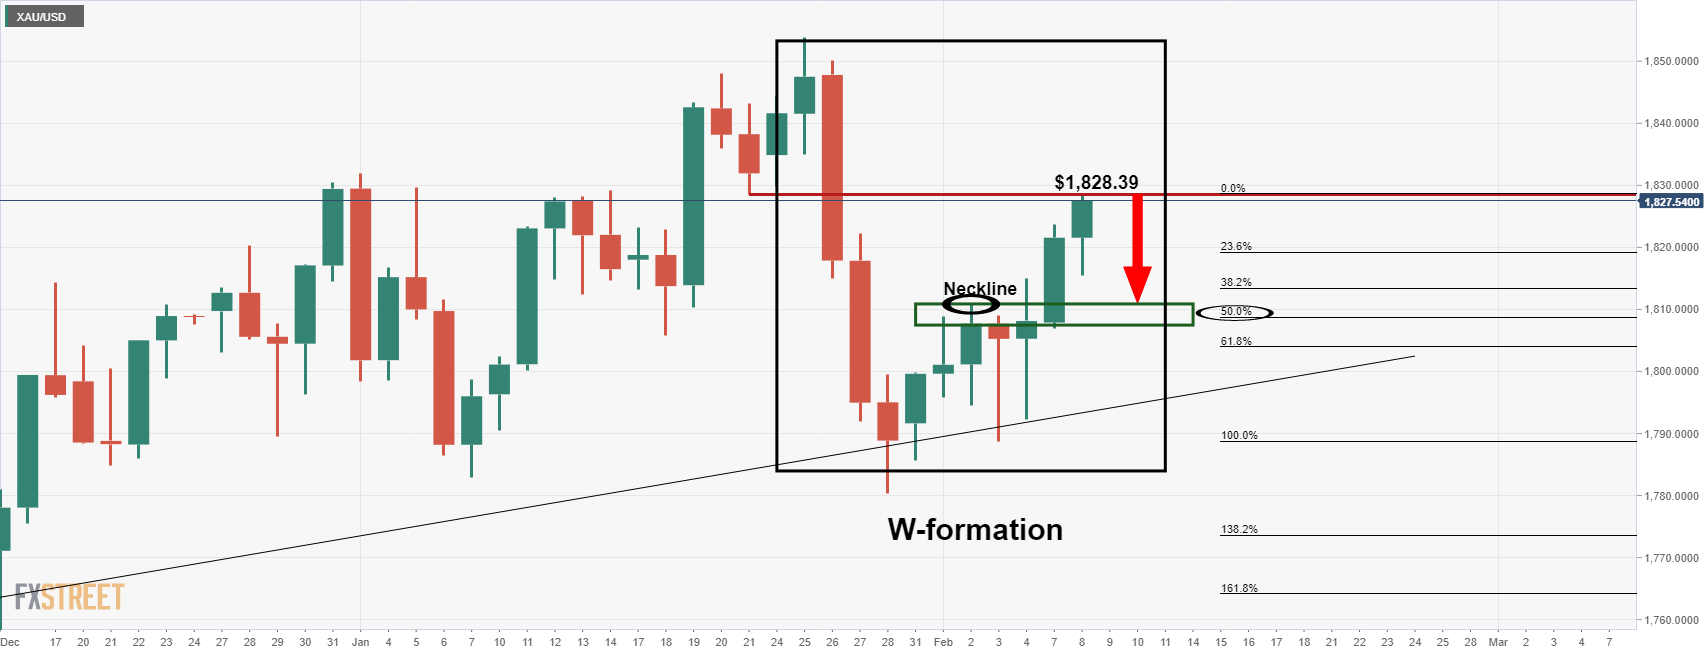
The W-formation's neckline aligns, albeit not perfectly to the US dollar, with a 50% mean reversion of the prior bullish impulse, so this is an ''area'' between $1,811 and $1,808 that the bears could be looking to target.
With all that being said, there is every possibility that the bulls will stay in control which exposes $1,850 on consecutive daily closes above the current highs. On the other hand, the bears will be monitoring for topping formations on both the daily and lower times frame charts at this juncture.
Author

Ross J Burland
FXStreet
Ross J Burland, born in England, UK, is a sportsman at heart. He played Rugby and Judo for his county, Kent and the South East of England Rugby team.


