Gold Price Forecast: XAU/USD key levels to watch amid cautious markets – Confluence Detector


Gold price continues to remain at the mercy of the dynamics in the US bond market and the developments surrounding the Russia-Ukraine crisis. Gold price has enjoyed good two-way businesses so far this Monday, although the renewed upside lacks follow-through momentum. Risk sentiment has turned sour as the EU readies more sanctions against Russia, which will buoy the safe-haven US dollar’s demand at gold’s expense. Further, the hawkish Fed’s outlook-led rally in the US Treasury yields is also likely to keep gold sellers cheerful, in the absence of top-tier economic events.

Read: Will commodities continue to outperform In Q2 2022? [Video]

Gold Price: Key levels to watch

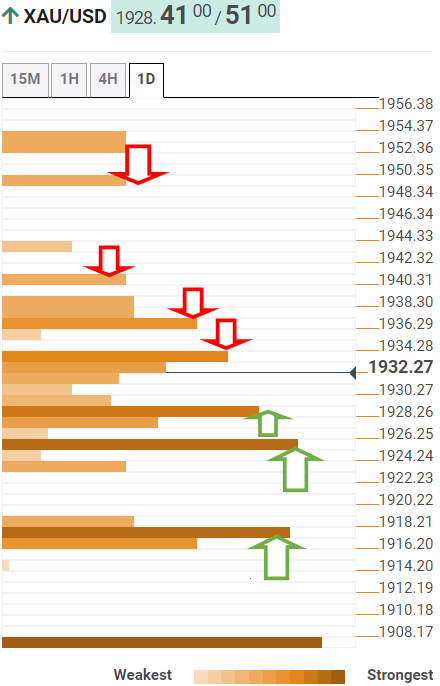
The Technical Confluences Detector shows that gold price is testing offers at powerful resistance of the Fibonacci 61.8% one-week at $1,934.

If the latter is scaled, then gold bulls will face the next relevant resistance around $1,937, which is the confluence of the pivot point one-day R1, SMA 50, 100 and 200 four-hour.

The previous day’s high at $1,940 will test the bearish commitment further up. A sustained break above that level will fuel a fresh rally towards the pivot point one-day R2 at $1,949.

On the flip side, gold sellers are attacking strong support at $1,928, which is the SMA5 one-day.

The next downside target aligns at $1,925, the confluence of the SMA5 four-hour and the Fibonacci 23.6% one-day.

Fierce cap at around $1,917 will be the last resort for gold bulls, as the latter is the intersection of the Fibonacci 38.2% one-week, the previous day’s low and the pivot point one-day S1.

Here is how it looks on the tool

  fxsoriginal

About Technical Confluences Detector

The TCD (Technical Confluences Detector) is a tool to locate and point out those price levels where there is a congestion of indicators, moving averages, Fibonacci levels, Pivot Points, etc.  If you are a short-term trader, you will find entry points for counter-trend strategies and hunt a few points at a time. If you are a medium-to-long-term trader, this tool will allow you to know in advance the price levels where a medium-to-long-term trend may stop and rest, where to unwind positions, or where to increase your position size.

Share: Feed news

Information on these pages contains forward-looking statements that involve risks and uncertainties. Markets and instruments profiled on this page are for informational purposes only and should not in any way come across as a recommendation to buy or sell in these assets. You should do your own thorough research before making any investment decisions. FXStreet does not in any way guarantee that this information is free from mistakes, errors, or material misstatements. It also does not guarantee that this information is of a timely nature. Investing in Open Markets involves a great deal of risk, including the loss of all or a portion of your investment, as well as emotional distress. All risks, losses and costs associated with investing, including total loss of principal, are your responsibility. The views and opinions expressed in this article are those of the authors and do not necessarily reflect the official policy or position of FXStreet nor its advertisers. The author will not be held responsible for information that is found at the end of links posted on this page.

If not otherwise explicitly mentioned in the body of the article, at the time of writing, the author has no position in any stock mentioned in this article and no business relationship with any company mentioned. The author has not received compensation for writing this article, other than from FXStreet.

FXStreet and the author do not provide personalized recommendations. The author makes no representations as to the accuracy, completeness, or suitability of this information. FXStreet and the author will not be liable for any errors, omissions or any losses, injuries or damages arising from this information and its display or use. Errors and omissions excepted.

The author and FXStreet are not registered investment advisors and nothing in this article is intended to be investment advice.

Recommended content


Recommended content

Editors’ Picks

EUR/USD clings to gains above 1.0750 after US data

EUR/USD clings to gains above 1.0750 after US data

EUR/USD manages to hold in positive territory above 1.0750 despite retreating from the fresh multi-week high it set above 1.0800 earlier in the day. The US Dollar struggles to find demand following the weaker-than-expected NFP data.

EUR/USD News

GBP/USD declines below 1.2550 following NFP-inspired upsurge

GBP/USD declines below 1.2550 following NFP-inspired upsurge

GBP/USD struggles to preserve its bullish momentum and trades below 1.2550 in the American session. Earlier in the day, the disappointing April jobs report from the US triggered a USD selloff and allowed the pair to reach multi-week highs above 1.2600.

GBP/USD News

Gold struggles to hold above $2,300 despite falling US yields

Gold struggles to hold above $2,300 despite falling US yields

Gold stays on the back foot below $2,300 in the American session on Friday. The benchmark 10-year US Treasury bond yield stays in negative territory below 4.6% after weak US data but the improving risk mood doesn't allow XAU/USD to gain traction.

Gold News

Bitcoin Weekly Forecast: Should you buy BTC here? Premium

Bitcoin Weekly Forecast: Should you buy BTC here?

Bitcoin (BTC) price shows signs of a potential reversal but lacks confirmation, which has divided the investor community into two – those who are buying the dips and those who are expecting a further correction.

Read more

Week ahead – BoE and RBA decisions headline a calm week

Week ahead – BoE and RBA decisions headline a calm week

Bank of England meets on Thursday, unlikely to signal rate cuts. Reserve Bank of Australia could maintain a higher-for-longer stance. Elsewhere, Bank of Japan releases summary of opinions.

Read more

Forex MAJORS

Cryptocurrencies

Signatures