Gold Price Forecast: XAU/USD is on the defensive, as sellers' eye 200-DMA before US CPI
- XAU/USD dips 0.39%, targeting the 200-day EMA as traders anxiously await US inflation numbers.
- Fed’s varying tone: While Harker hints at steady rates, Bowman pushes for hikes to control inflation, impacting Gold’s momentum.
- US 10-year Treasury bond yield hovers at 4%, while the DXY index drops slightly, failing to increase appetite for Gold.

Gold price losses traction for the third straight day in the week tumbles 0.39% below its opening price as sellers eye a test of the 200-day Exponential Moving Average (EMA) at $1,908.12. Traders bracing for US inflation data release keep the yellow metal price depressed, exchanging hands at XAU/USD changes hands at $1,917.54.
Gold traders weigh US inflation projections and mixed Federal Reserve signals; eyes set on September rate hike odds
The XAU/USD treads water ahead of the release of the July inflation report, which is expected to show the deflationary process remains intact. Estimates for the Consumer Price Index monthly and annually stand at 0.2% and 3%, respectively. Monthly data would remain unchanged from June’s, while year-over-year (YoY) would show an improvement from 3.3%. Excluding volatile items, the so-called core CPI is foreseen to remain at 0.2% MoM, with annual inflation estimated to be 4.8%, the same as in June.
However, XAU/USD buyers could remain hopeful for higher prices, as most Federal Reserve (Fed) officials have begun to turn neutral or even dovish, as shown by Philadelphia Fed President Patrick Harker stating that rates could remain at current levels, barring any deterioration on US economic data, said on Tuesday. Contrarily, Fed Governor Michelle Bowman stated the Fed needs to keep the pedal to the metal, lifting rates to curb inflation.
Expectations for a rate hike in September remained depressed, with odds at a 13.5% chance, as shown by the CME FedWatch Tool. Any Fed signals for rate cuts in 2024 could increase the appetite for the non-yielding metal, which is suffering from high US Treasury bond yields.
The US 10-year Treasury bond yield dives two basis points to 4.00% but remains above the figure, a headwind for XAU/USD, while the US Dollar Index (DXY), a measure of the greenback’s performance against its peers, loses traction, edges to 102.436, down 0.10%.
XAU/USD Price Analysis: Technical outlook
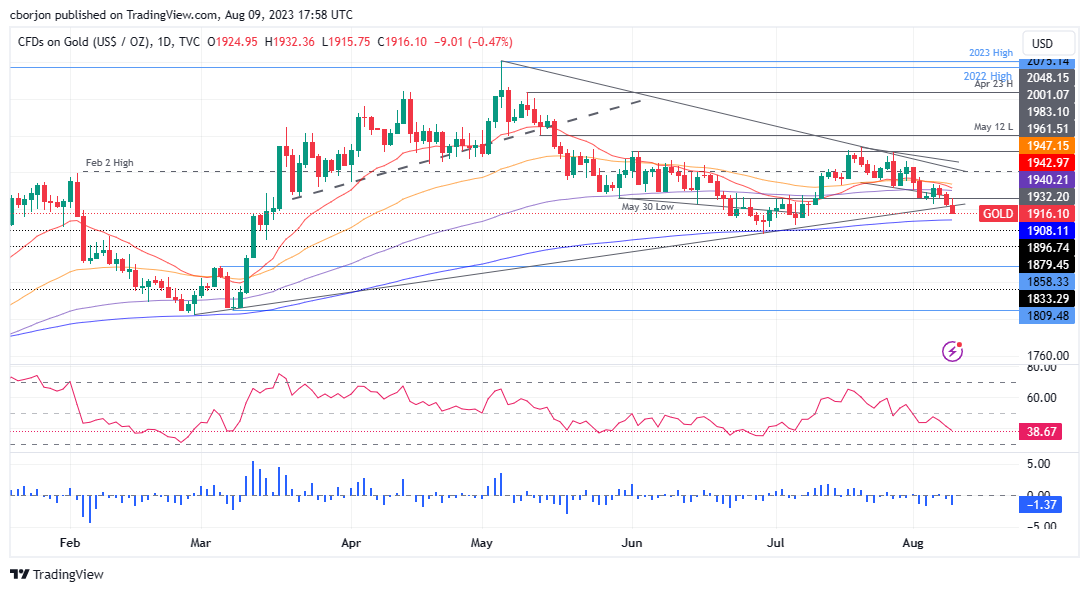
XAU/USD price is depressed after testing the lows of June at around $1,893.12, extended its gains toward the July 20 swing high at $1,987.42, though buyers’ failure to crack the latter exacerbated a pullback toward current gold price. On its way south, XAU/USD breached the 20, 50, and 100-day EMAs and as of writing, is breaking below a five-month-old support trendline that passes at around $1,922/$1,930. A daily close would expose the 200-day EMA, followed by the $1,900 figure.
From an oscillator’s view, the Relative Strength Index (RSI) and the three-day Rate of Change (RoC) suggest further downside expected as sellers remain in charge.
Author

Christian Borjon Valencia
FXStreet
Markets analyst, news editor, and trading instructor with over 14 years of experience across FX, commodities, US equity indices, and global macro markets.


