Gold Price Forecast: XAU/USD floats above short-term key levels past $1,800 – Confluence Detector
- Gold stayed mildly bid around weekly top before Christmas Eve.
- Risk-on mood battles recently firmer yields to test buyers.
- Sellers need to conquer strong hurdles to retake controls.
- Gold 2022 Outlook: Correlation with US T-bond yields to drive yellow metal

Gold (XAU/USD) prices refreshed weekly high before turning dead around $1,810 as market players struggle for fresh clues during the Christmas holidays in the West.
The yellow metal buyers initially cheered optimism tackling the South African covid variant, dubbed as Omicron, as well as US President Joe Biden’s Build Back Better (BBB). However, firmer US data propelled the Treasury yields to a monthly peak and challenged the buyers afterward. Also testing the gold buyers were pessimism surrounding the Sino-US relations and doubts over the recently approved covid pills, not to forget US Senator Joe Manchin’s full-stop to negotiations over the current version of the Build Back Better Act.
That said, the gold bulls have an upper hand considering the cautious optimism in the market but the bears are lurking for entry while waiting for fresh clues. As a result, the final days of 2021 are likely to restrict the gold price moves amid an absence of major data/events.
Read: Gold Price Forecast: XAU/USD portrays Christmas mood above $1,800
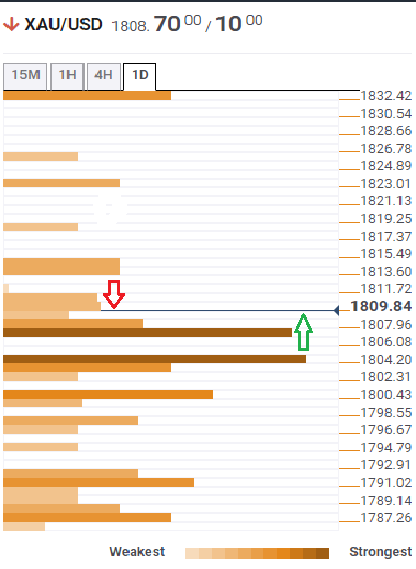
Gold Price: Key levels to watch
The Technical Confluences Detector shows that the gold prices have already crossed the key hurdles around $1,804 and $1,809 but refrained to cross the weekly high near $1,814.
That said, the latest advances aim for $1,814 comprising Bollinger Band four-hour upper, previous weekly high and pivot point one-day R1.
Following that, the metal’s run-up towards the $1,823 level including pivot point one-week R1 can’t be ruled out. However, any further advances will be challenged by the $1,834 level comprising 61.8% Fibo. on monthly, as well as tops marked during July and September.
On the contrary, Fibonacci 38.2% one-day, SMA 200 on four-hour and Bollinger Band one-day upper will restrict the immediate downside around $1,809.
Also acting as short-term key support is $1,804 level that encompasses Fibonacci 61.8% one-day, Bollinger Band one-hour lower and SMA 10 on four-hour.
Even if the quote drops below $1,804, SMA 50 one-day and Fibonacci 23.6% one-week will offer an additional filter to the south before directing the quote towards $1,791 that has SMA 10 one-day and Fibonacci 38.2% one-week.
Here is how it looks on the tool
About Technical Confluences Detector
The TCD (Technical Confluences Detector) is a tool to locate and point out those price levels where there is a congestion of indicators, moving averages, Fibonacci levels, Pivot Points, etc. If you are a short-term trader, you will find entry points for counter-trend strategies and hunt a few points at a time. If you are a medium-to-long-term trader, this tool will allow you to know in advance the price levels where a medium-to-long-term trend may stop and rest, where to unwind positions, or where to increase your position size.
Author

Anil Panchal
FXStreet
Anil Panchal has nearly 15 years of experience in tracking financial markets. With a keen interest in macroeconomics, Anil aptly tracks global news/updates and stays well-informed about the global financial moves and their implications.


