Gold Price Forecast: XAU/USD faces a wall of resistance ahead of key US events – Confluence Detector
- Gold price is retreating from three-week highs, as the US dollar finds demand.
- The metal awaits critical US economic data for clarity on the Fed’s policy.
- $1,730-$1,735 supply zone appears a tough nut to crack for XAU/USD bulls.

Gold price is pulling back from three-week highs of $1,730, as the US dollar is finding fresh demand so far this Wednesday. The bright metal is snapping its two-day rally, as markets are turning cautious heading into the critical US economic data in the second half of this week. After weak US ISM Manufacturing and Job Openings data, investors started betting that the Fed will slow down its tightening pace, as the economy appears to be cooling. The dollar sell-off alongside the Treasury yields on Tuesday, therefore, helped the USD-priced bullion extend its recovery momentum above the $1700 threshold. Gold’s fate now hinges on the upcoming US employment data, which will provide more clarity on the size of the November Fed rate hike. According to the CME Group’s FedWatch Tool, markets are pricing a 62% chance of a 75 bps lift-off by the Fed next month, up from roughly 50% seen a day ago.
Also read: Chart of the day: Gold
Gold Price: Key levels to watch
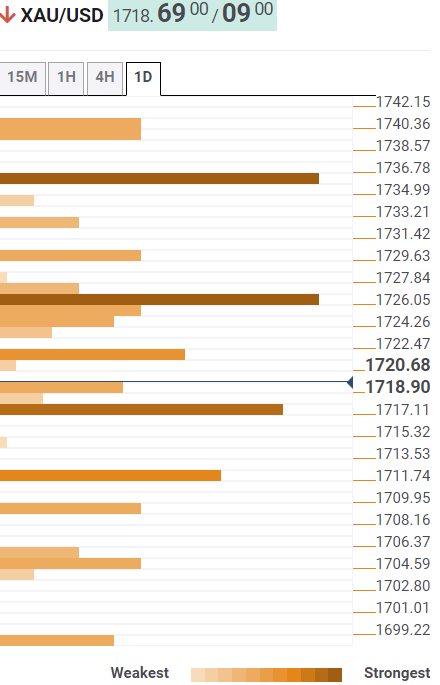
The Technical Confluence Detector shows that the gold price is closing in on the Fibonacci 38.2% one-day support at $1,717, below which a fresh drop towards the pivot point one-week R2 at $1,711 will be in the offing.
The next stop for sellers is seen at the Fibonacci 61.8% one-day at $1,709 while the confluence of the SMA10 four-hour and pivot point one-day S1 at $1,705 will offer a strong cushion to buyers.
On the flip side, the immediate resistance is aligned at $1,721, the Fibonacci 23.6% one-day, above which the next powerful barrier around $1,726 will get retested. That level is the confluence of the pivot point one-month R1 and SMA50 one-day.
The previous day’s high of $1,730 will be on the buyers’ radars if the upswing gathers steam. The previous month’s high of $1,735 will be irresistible for gold optimists.
Here is how it looks on the tool
About Technical Confluences Detector
The TCD (Technical Confluences Detector) is a tool to locate and point out those price levels where there is a congestion of indicators, moving averages, Fibonacci levels, Pivot Points, etc. If you are a short-term trader, you will find entry points for counter-trend strategies and hunt a few points at a time. If you are a medium-to-long-term trader, this tool will allow you to know in advance the price levels where a medium-to-long-term trend may stop and rest, where to unwind positions, or where to increase your position size.
Author

Dhwani Mehta
FXStreet
Residing in Mumbai (India), Dhwani is a Senior Analyst and Manager of the Asian session at FXStreet. She has over 10 years of experience in analyzing and covering the global financial markets, with specialization in Forex and commodities markets.















