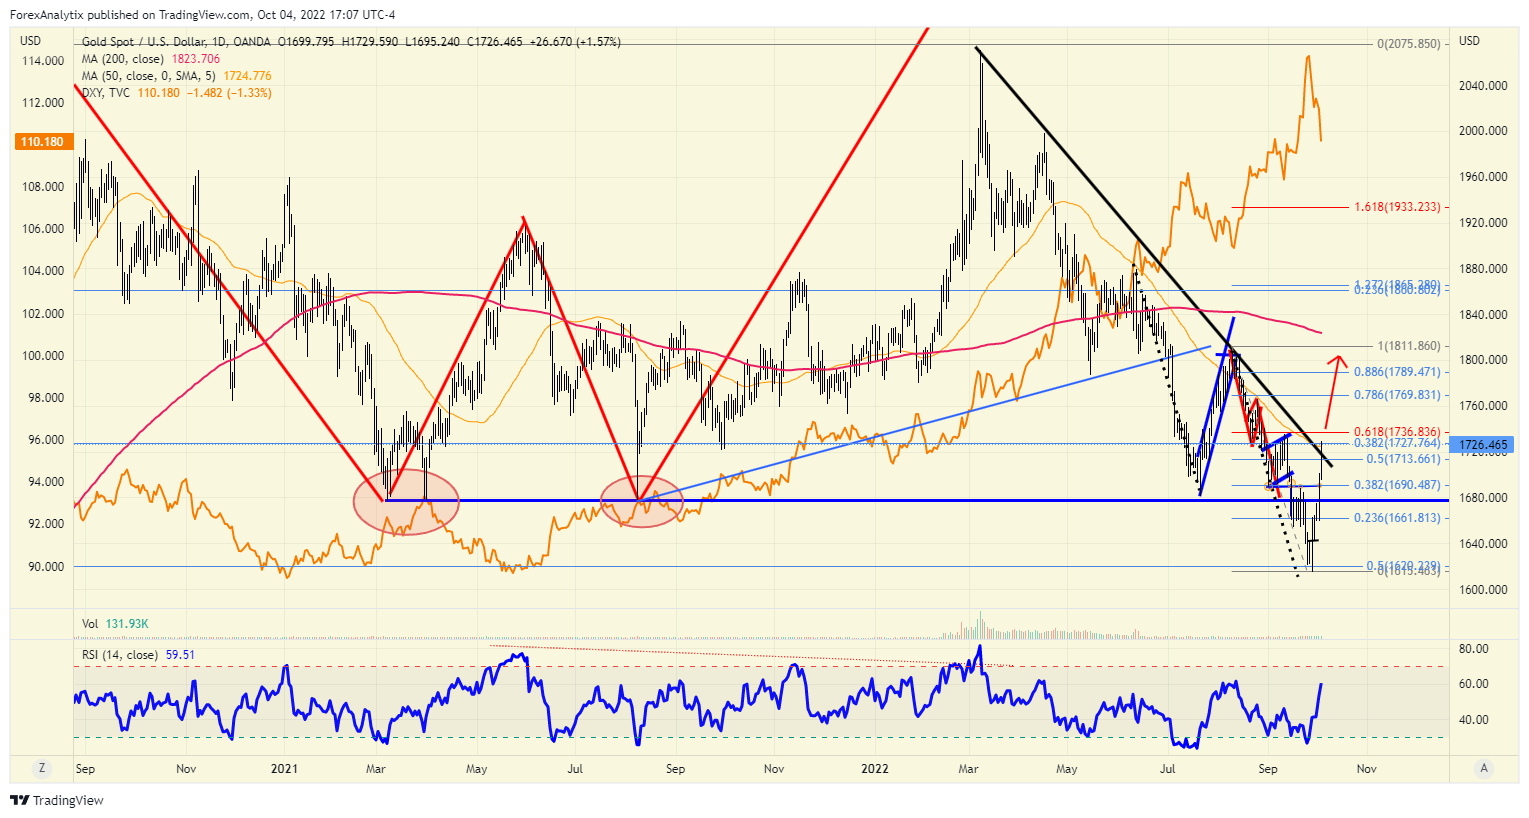
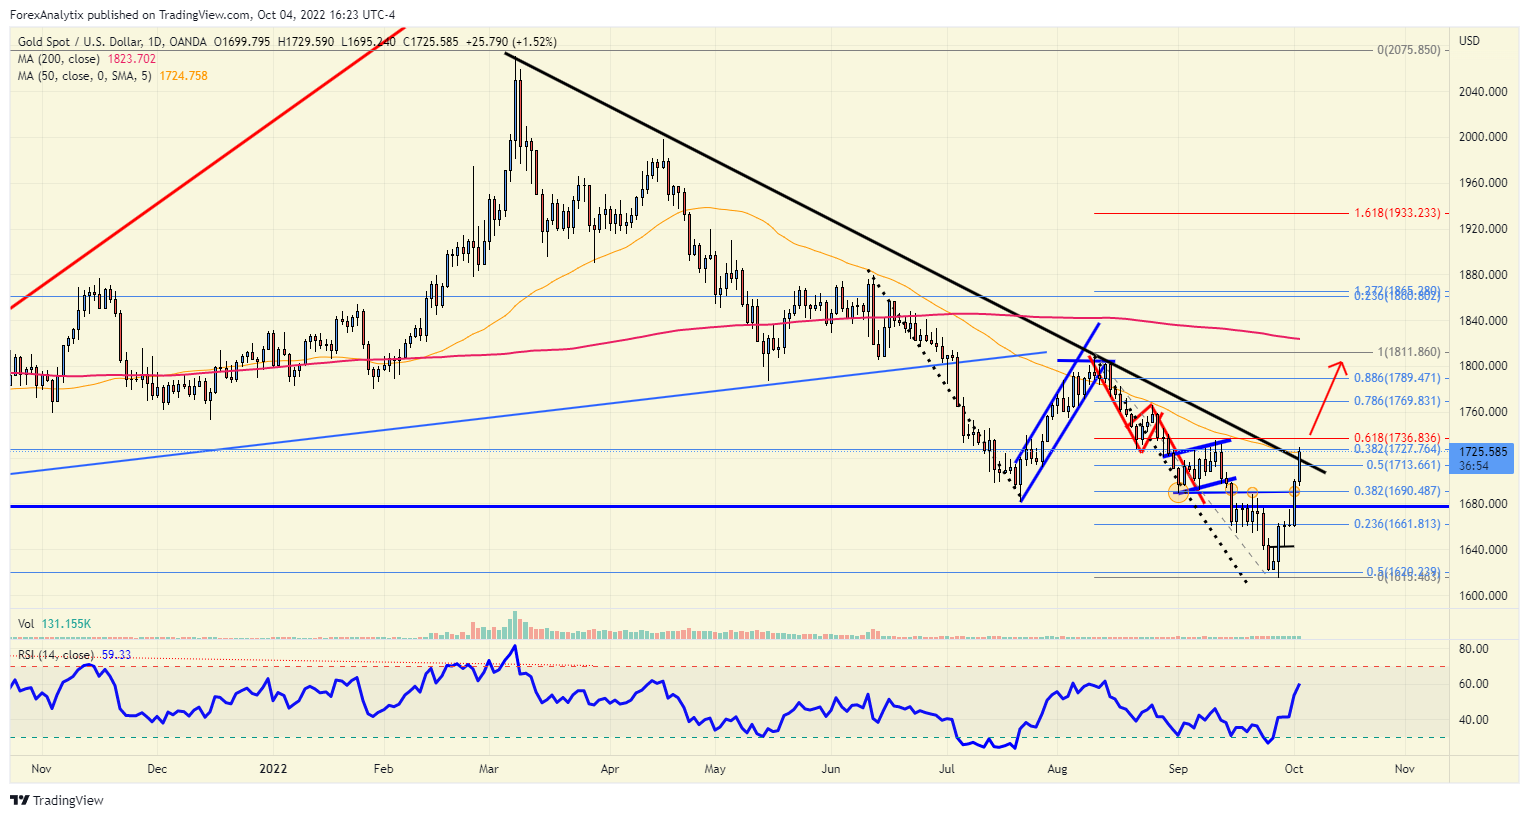
Chart of the day: Gold

The break higher in gold today suggest that while we trade above the 1700 level the risk if for a move higher towards the 1736 level and possibly the 200dma in the coming weeks ahead. The trend line which was broken today was measured from the highs of March 2022. The break back above the 1700 level suggests that last month’s breakdown may be false. RSI is pointing higher and does also suggest higher prices. Also, keep in mind stronger gold prices usually means weaker US Dollar.
Author

Aaron Hill
FP Markets
After completing his Bachelor’s degree in English and Creative Writing in the UK, and subsequently spending a handful of years teaching English as a foreign language teacher around Asia, Aaron was introduced to financial trading,
More from Aaron Hill


