Gold Price Forecast: XAU/USD eyes $1801 as the next bullish target – Confluence Detector
- Gold price hits fresh five-day tops at $1795 amid risk-on mood, USD pullback.
- Listless US Treasury yields support gold price, as inflation risks loom.
- Gold: Sellers defend $1,800, all eyes on US T-bond yields.

Gold price is approaching the $1800 mark, holding near the highest levels in five days, as the US dollar fades its recovery rally amid improving market mood. although the bulls appear to lack follow-through upside amid a rebound in the US dollar across the board. Gold price remains undeterred by the record run on the Wall Street indices, as growing inflation fears amid supply bottlenecks and rising energy prices, continue to benefit the traditional inflation hedge. However, it remains to be seen if gold price can hold the fort, in the face of persistent Fed’s tapering expectations.
Read: Gold Price Forecast: XAU/USD eyes a firm break above $1795 amid growing inflation fears
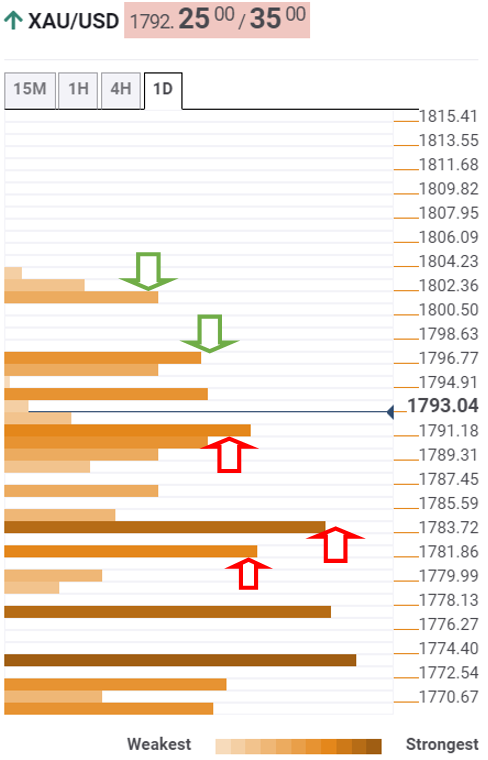
Gold Price: Key levels to watch
The Technical Confluences Detector shows that gold is cheering a fresh bid-wave, as it approaches a critical hurdle at $1795-$1796, which is the convergence of the pivot point one-day R2 and Bollinger Band one-day Upper.
The next stop for gold bulls is seen at the confluence of the previous week’s high and the pivot point one-day R3 at $1801.
A sustained break above the latter will open doors for a fresh rally towards the mid-September highs of $1809.
On the flip side, a dense cluster of support levels around $1789 caps the immediate downside. At that level, the previous day’s high coincides with the pivot point one-day R1 and Fibonacci 23.6% one-week.
The next downside target is envisioned at $1786, which is the Fibonacci 23.6% one-day
Sellers will then look to test critical support at $1783, the intersection of the SMA10 four-hour, Fibonacci 38.2% one-day and SMA50 one-hour.
The last line of defense for gold bulls is seen at $1781, the Fibonacci 61.8% one-day’s and Fibonacci 38.2% one-week’ meeting point.
Here is how it looks on the tool
About Technical Confluences Detector
The TCD (Technical Confluences Detector) is a tool to locate and point out those price levels where there is a congestion of indicators, moving averages, Fibonacci levels, Pivot Points, etc. If you are a short-term trader, you will find entry points for counter-trend strategies and hunt a few points at a time. If you are a medium-to-long-term trader, this tool will allow you to know in advance the price levels where a medium-to-long-term trend may stop and rest, where to unwind positions, or where to increase your position size.
Author

Dhwani Mehta
FXStreet
Residing in Mumbai (India), Dhwani is a Senior Analyst and Manager of the Asian session at FXStreet. She has over 10 years of experience in analyzing and covering the global financial markets, with specialization in Forex and commodities markets.


