Gold Price Forecast: XAU/USD eyes $1,831 and US inflation – Confluence Detector
- Gold price continues to remain at the mercy of the Treasury yields’ price action.
- Powell likely hesitates on balance sheet run-off ahead of key US inflation.
- Gold Price Forecast: Will US inflation boost XAU/USD further to $1,835?

Gold price holding higher ground, as Fed Chair Powell vowed to tame inflation and put off-balance sheet runoff to "perhaps later in the year". Nevertheless, the price action in the US dollar and the Treasury yields continue to influence gold’s valuations, with Wednesday’s US Consumer Price Index (CPI) eagerly waited for a decisive direction.
“Economists expect inflation to have hit 7% YoY in the final report for 2021. Political pressure around inflation makes headline prices more important than Core CPI at this point,” FXStreet’s Senior Analyst Yohay Elam explains.
Read: Gold 2022 Outlook: Correlation with US T-bond yields to drive yellow metal
Gold Price: Key levels to watch
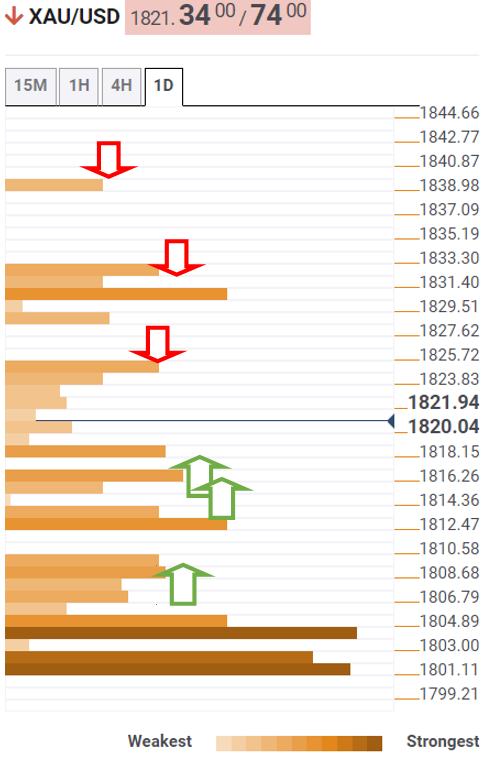
The Technical Confluences Detector shows that the gold price is re-approaching the previous day’s high of $1,823, where the pivot point one-week R1 hangs around.
If that hurdle is scaled, then gold bulls will march higher towards the strong cap around $1,831, the convergence of the previous month’s and previous week’s highs.
The next significant barrier is seen at the pivot point one-day R2 at $1,839.
On the flip side, the immediate downside could be checked by the intersection of the Fibonacci 23.6% one-day and the previous low four-hour at $1,817.
A dense cluster of healthy support levels is stacked up around $1,814, making it a tough nut to crack for gold bears.
That demand area is the confluence of the Fibonacci 23.6% one-month, Fibonacci 61.8% one-week and Fibonacci 38.2% one-day.
Should the downside pressure intensify, robust cushion at $1,809 could come into play. At that point, the SMA10 one-day and Fibonacci 61.8% one-day converge.
The last line of defense for gold buyers is envisioned at the SMA5 one-day at $1,805.
Here is how it looks on the tool
About Technical Confluences Detector
The TCD (Technical Confluences Detector) is a tool to locate and point out those price levels where there is a congestion of indicators, moving averages, Fibonacci levels, Pivot Points, etc. If you are a short-term trader, you will find entry points for counter-trend strategies and hunt a few points at a time. If you are a medium-to-long-term trader, this tool will allow you to know in advance the price levels where a medium-to-long-term trend may stop and rest, where to unwind positions, or where to increase your position size.
Author

Dhwani Mehta
FXStreet
Residing in Mumbai (India), Dhwani is a Senior Analyst and Manager of the Asian session at FXStreet. She has over 10 years of experience in analyzing and covering the global financial markets, with specialization in Forex and commodities markets.


