Gold Price Forecast: Will US inflation boost XAU/USD further to $1,835?
- Gold price bides time ahead of the critical US inflation data.
- Powell vowed to fight inflation, put off balance sheet runoff to "perhaps later in the year".
- Daily technical setup favors gold bulls, as a test of $1,836 remains likely.

Gold price outperformed on Tuesday and rose to its highest levels in four days at $1,823, in an extension of the recovery from three-week lows of $1,783. The main catalyst behind gold’s upsurge, undoubtedly remained the US dollar’s weakness, courtesy of the sharp correction in the Treasury yields from almost two-year highs. In doing so, gold price found acceptance above the critical 50-Daily Moving Average (DMA), which offered the extra zest to bulls. The dollar tumbled alongside the yields after Fed Chair Jerome Powell showed some hesitance in the central bank’s balance sheet reduction plans this year. During his confirmation hearing on Tuesday, Powell puts off balance sheet runoff to "perhaps later in the year". Meanwhile, Powell’s pledge to ward off inflation in the year ahead offered relief to the US stocks, as Wall Street indices staged an impressive comeback, led by the tech-heavy Nasdaq Composite Index.
In the run-up to the critical US inflation release, gold price has turned south, as investors resort to profit-taking. The dollar licks it wounds amid a better market mood, despite growing coronavirus cases in China. Traders ignore the global economic growth downgrade by the World Bank, as the focus remains on the US inflation report. The annualized US Consumer Price Index (CPI) is expected to hit another 40-year high, arriving at 7% in December vs. 6.8% recorded previously. The core CPI is seen higher at 5.4% YoY in December vs. 4.9% previous. Hotter US inflation will also seal in a March Fed rate hike. That said, the US dollar could witness ‘sell the fact’ trading in reaction to the data, which could prompt a fresh run higher in gold price. Although should the sentiment on Wall Street deteriorate on inflationary fears, then the greenback could emerge as a winner, extending the corrective pullback in gold price.
Gold Price Chart - Technical outlook
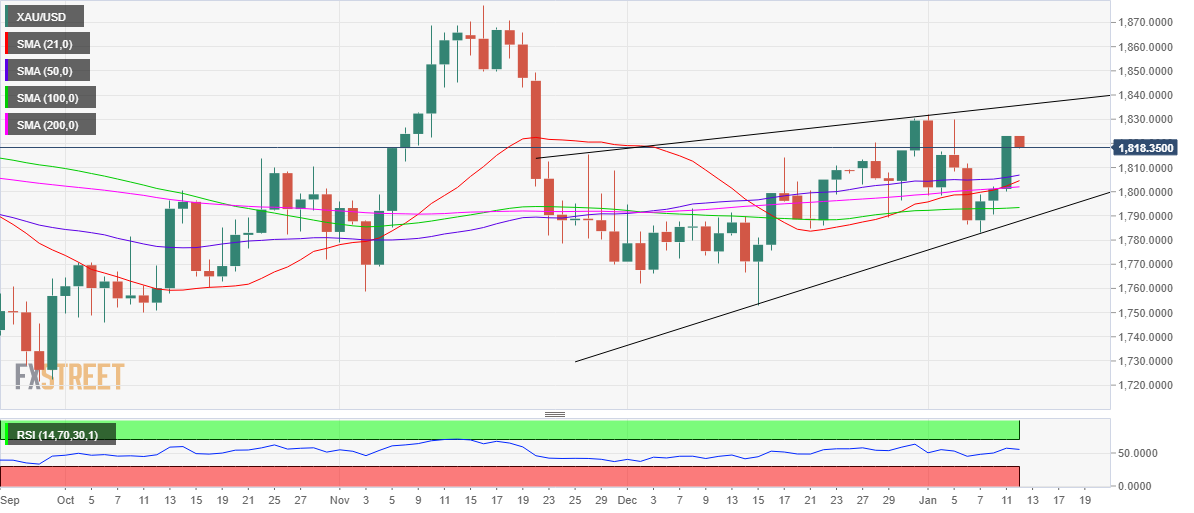
Gold: Daily chart
Gold price holds fort above the 50-DMA, now at $1,807, despite the retracement from higher levels.
The 21- and 200-DMAs bullish crossover is also playing out, following confirmation on a daily basis, which keeps gold buyers hopeful.
The 14-Relative Strength Index (RSI) has turned slightly lower but continues to hold above the midline, suggesting that the upside potential remains intact.
Should the US inflation data spell risk aversion, then gold price could extend the downtick towards the 50-DMA, below which strong support awaits at around $1,803, the confluence of the 21- and 200-DMAs.
Further south, the horizontal 100-DMA cap at $1,793 could come into play.
Alternatively, bulls would challenge Tuesday’s high if the US CPI data triggers a renewed USD sell-off.
The next fierce hurdle on the upside is seen at the monthly highs near $1,830 levels. Gold buyers will then gear up for a test of the wedge resistance at $1,836.
It’s worth noting that the price has been traversing in a potential rising wedge formation since the November 26 peak.
Author

Dhwani Mehta
FXStreet
Residing in Mumbai (India), Dhwani is a Senior Analyst and Manager of the Asian session at FXStreet. She has over 10 years of experience in analyzing and covering the global financial markets, with specialization in Forex and commodities markets.


