Gold Price Forecast: XAU/USD eyes $1,804 and $1,800 as US Treasury yields spike – Confluence Detector
- Gold bears fight back control as US 10-year Treasury yields hit two-year highs.
- Russia-Ukraine crisis, aggressive Fed rate hike bets triggered the yields spike.
- Gold 2022 Outlook: Correlation with US T-bond yields to drive yellow metal.

The Fed policymakers have entered a blackout period ahead of next week’s FOMC decision. What is moving the US Treasury yields, dollar and gold then? With the return of full markets on Tuesday, investors brace for heightened tensions between Russia and Ukraine, causing the risk premium to explode and driving the benchmark US 10-year yields to a new two-year high of $1.85%. The US rates also jumped, sending the dollar higher, on speculation of aggressive Fed rate hike in March to the tune of 50bps.
Looking ahead, in absence of relevant US economic data due for release on Tuesday, the Fed sentiment and geopolitical tensions will continue to influence gold price. Higher yields tend to weigh on the non-interest-bearing gold price.
Read: Gold Price Forecast: XAU/USD weighed down by surging US bond yields, stronger USD
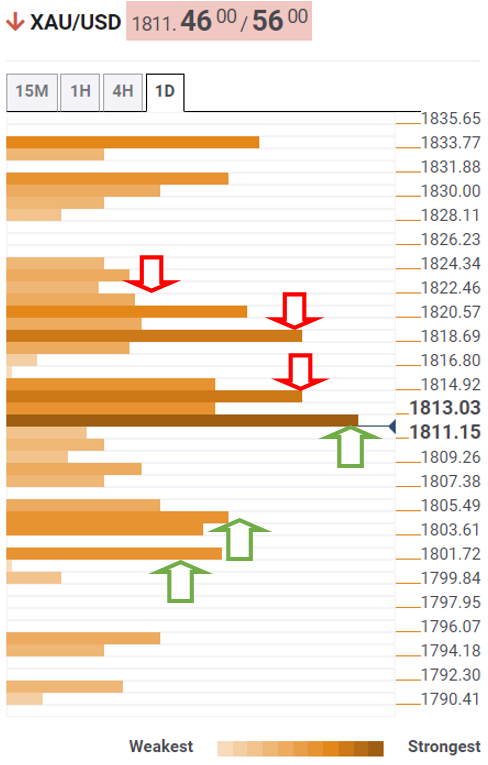
Gold Price: Key levels to watch
The Technical Confluences Detector shows that the gold price is testing the bullish commitments at $1,811, which is a powerful resistance of the SMA10 one-day and SMA100 four-hour.
The next support awaits at the 50-DMA of $1,808, below which a dense cluster of healthy cushions align at $1,804. At that point, the SMA200 one-day coincides with the Fibonacci 61.8% one-week and pivot point one-day S3.
The last line of defense for gold bulls is seen at $1,800, the Fibonacci 38.2% one-month.
On the flip side, the previous day’s low at $1,813 offers immediate resistance, followed by the intersection of the SMA5 and 10 four-hour.
Fibonacci 23.6% one-week at $1,820 will emerge as the next significant upside barrier.
Bulls will then challenge the previous day’s high at $1,823.
Here is how it looks on the tool
About Technical Confluences Detector
The TCD (Technical Confluences Detector) is a tool to locate and point out those price levels where there is a congestion of indicators, moving averages, Fibonacci levels, Pivot Points, etc. If you are a short-term trader, you will find entry points for counter-trend strategies and hunt a few points at a time. If you are a medium-to-long-term trader, this tool will allow you to know in advance the price levels where a medium-to-long-term trend may stop and rest, where to unwind positions, or where to increase your position size.
Author

Dhwani Mehta
FXStreet
Residing in Mumbai (India), Dhwani is a Senior Analyst and Manager of the Asian session at FXStreet. She has over 10 years of experience in analyzing and covering the global financial markets, with specialization in Forex and commodities markets.


