Gold Price Forecast: XAU/USD consolidates in weekly highs near $1,830, US Retail Sales eyed
- Gold price hits weekly highs amid weaker US dollar despite hawkish Fed.
- Focus shifts to the US Retail Sales and Consumer Sentiment releases.
- Gold bulls strive hard to find acceptance above monthly highs of $1,832.

Gold price is easing from fresh one-week highs of $1,829, as sellers continue to lurk around the $1,830 area.
The pullback in gold price is mainly sponsored by a brief bounce in the US dollar across its main competitors, as bears take a breather ahead of the US Retail Sales release. The US dollar index is currently trading at 94.70, slightly off the two-month troughs of 94.60.
The rout in the US currency comes on the heels of a 40-year higher inflation rate, which triggered a ‘sell the fact’ reaction in the buck. Investors also believed that real returns in the Emerging Markets (EM) could be higher amid soaring inflation in America, reducing the dollar’s attractiveness.
The tech sell-off on Wall Street also added to the greenback’s misery, as gold price keeps its bullish momentum intact. However, the bright metal witnessed a sharp corrective downside on Thursday, despite the persistent weakness in the Treasury yields and the dollar, as the March Fed rate hike seems a done deal.
All eyes remain on the US Retail Sales, Michigan Consumer Sentiment and Fed official Williams’ speech before the Fed enters into a blackout period ahead of this month’s FOMC decision due on January 26.
The US Retail Sales is expected to see no growth in December vs. +0.3% booked previously. Meanwhile, the Preliminary Consumer Sentiment is seen dipping to 70.0 in January vs. 70.6 prior.
Gold Price Chart - Technical outlook
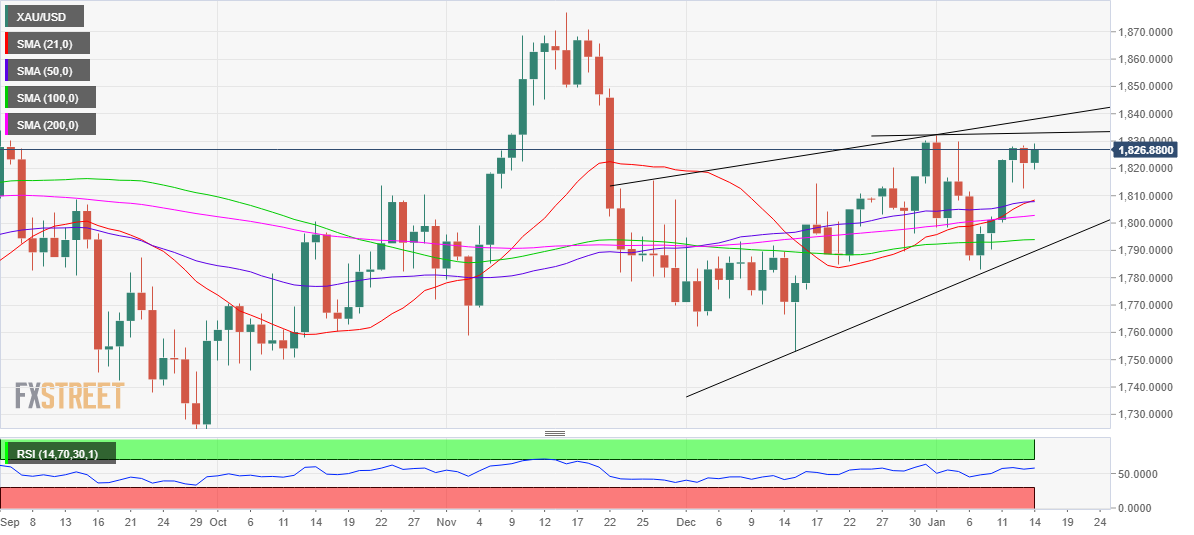
Gold: Daily chart
Gold price is consolidating near-weekly so far this Friday, gathering pace to yield a big break above the $1,831-32 supply zone. At that level, the previous week’s high and monthly highs coincide.
The next stop for gold bulls is envisioned at the rising trendline (wedge) resistance, now at $1,838.
It’s worth noting that the higher highs and higher lows formation on the said time frame since end-November has taken the shape of a rising wedge.
Daily closing above the latter will validate the wedge, calling for a fresh rally towards the $1,850 mark.
The 14-Relative Strength Index (RSI) holds well above the midline while the 21-Daily Moving Average (DMA) has crossed the 50-DMA for the upside, bolstering the bullish potential.
On the other hand, if the corrective downside picks up pace, then a retest of Thursday’s low of $1,812 will be imminent.
The further downside will challenge the 21 and 50-DMAs confluence at $1,808, below which the mildly bullish 200-DMA at $1,803 will come to the rescue of XAU bulls.
Gold: Additional technical levels to consider
Author

Dhwani Mehta
FXStreet
Residing in Mumbai (India), Dhwani is a Senior Analyst and Manager of the Asian session at FXStreet. She has over 10 years of experience in analyzing and covering the global financial markets, with specialization in Forex and commodities markets.


