Gold Price Forecast: XAU/USD climbs amidst US debt ceiling uncertainty, falling US bond yields
- XAU/USD rallies, benefiting from concerns over the US debt ceiling and slowing Chinese manufacturing activity.
- Falling US Treasury bond yields support gold prices despite strong US Dollar.
- Eyes on upcoming US CPI data, which has the potential to impact gold prices.

Gold price is printing back-to-back bullish days as the XAU/USD meanders nearby Monday’s high of $2029.40, bolstered by falling US Treasury bond yields despite a strong US Dollar (USD). The XAU/USD is underpinned by uncertainty around the US debt ceiling and a US inflation report looming. At the time of writing, the XAU/USD is trading at $2030.68, above its opening price by 0.48%.
XAU/USD bolstered by risk aversion, lower US bond yields
The negative tone is being reflected by Wall Street registering losses. Worries about politics, namely the debt ceiling, weighed on market sentiment. Credit conditions in the United States (US) began to tighten, as shown by the Fed’s Senior Loan Officer Opinion Survey (SLOOS), though “not as disastrous as many doomsayers had feared,” Analysts at Brown Brothers Harriman noted.
Another reason that bolstered appetite for XAU/USD was that China’s revealed that manufacturing activity slowed down. At the same time, its Trade Balance showed that Exports and Imports dropped from 14.8% to 8.5% in April and from -1.4% to -7.9%, respectively.
On Tuesday, US President Joe Biden will host US Congress officials to lay the ground around getting a consensus on the US debt ceiling.
In the meantime, the US Dollar Index (DXY), a gauge that tracks the performance of six currencies against the US Dollar, climbs 0.29%, up at 101.680, capping XAU/USD’s rally. US Treasury bond yields are mixed, though the short term, the most sensitive to interest rates, the 2-year note gains one bps, at 4.024%.
In the meantime, the Fed parade has begun, led by Fed Governor Philip Jefferson, who said the banking system was sound and resilient and that institutions had begun to raise lending standards. Regarding inflation, it has started to slow in an “orderly fashion” and will come down as the economy continues to grow.
Of late, the New York Fed President John Williams stated, “We haven’t said we are done,” adding that it would be data dependent and could raise rates if needed.
Upcoming events in the US economic calendar
On the US front, the Consumer Price Index (CPI) for April is expected at 5% YoY, while the core reading is at 5.5%.
XAU/USD Technical Analysis
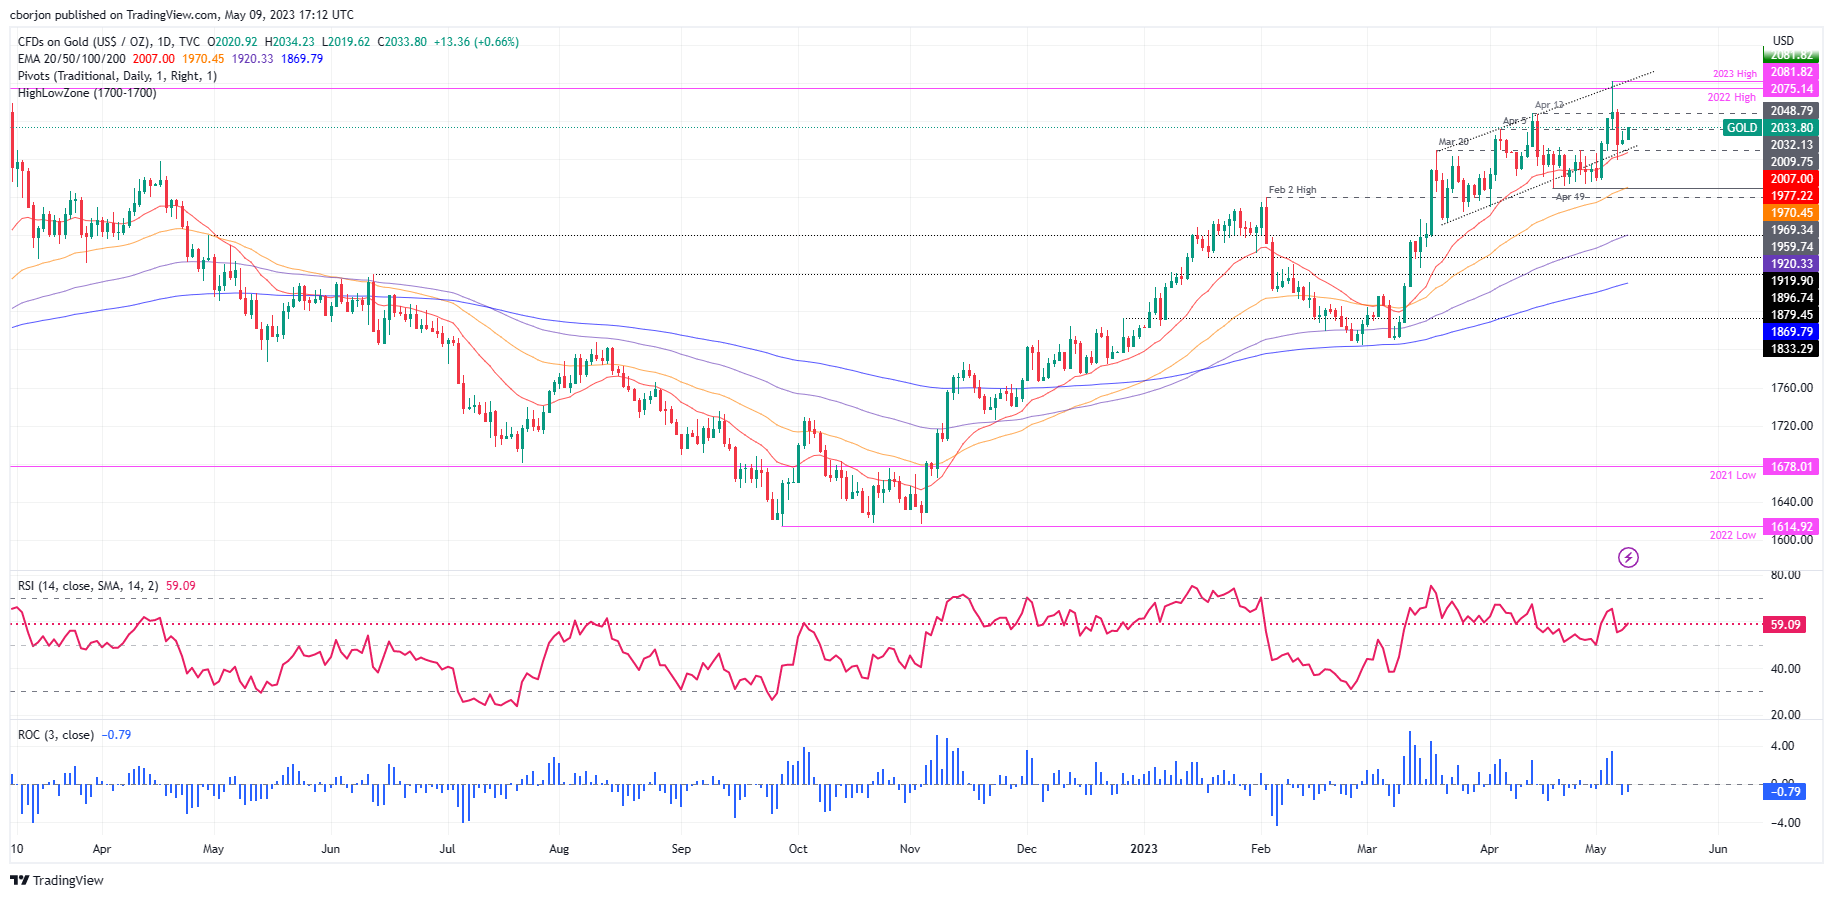
The XAU/USD recovered some ground after testing the 20-day EMA at $2006.62, which also intersected with a one-month-old upslope support trendline. However, it’s facing solid resistance at around the April 5 high of $2032.13, which, if broken, would clear the way for XAU/USD to challenge the April 13 high at $2048.79.
On the flip side, the XAU/USD first support would be the 20-day EMA at $2006.83, followed by the $2000 figure. Once broken, it would expose the April 19 swing lows at $1969.34.
Author

Christian Borjon Valencia
FXStreet
Markets analyst, news editor, and trading instructor with over 14 years of experience across FX, commodities, US equity indices, and global macro markets.


