Gold Price Forecast: XAU/USD bulls gearing up for a rally toward $1,822 – Confluence Detector


  • Gold price kicks off the week on a solid footing, as the US Dollar extends weakness.  
  • China reopening optimism and dovish Fed expectations offset higher US Treasury yields.
  • Gold price eyes a fresh upswing toward $1,822 amid a lack of healthy resistance levels.    

Gold price is trading close to its best levels in five months above $1,800 at the start of a new week, with risk flows dominating as China expands the covid reopening to Shanghai and Hangzhou. A better risk profile and dovish Federal Reserve expectations continue to remain a weight on the US Dollar, despite a big beat on the US Nonfarm Payrolls data. The US economy added 263,000 jobs in November, better than 200,000 but below 284,000 in October, according to the latest data released last Friday. Following the upbeat US payrolls data, markets appear convinced that the Fed’s dovish pivot could help the economy with a ‘soft landing’. The Fed has entered the ‘blackout period’ and, therefore, all eyes now remain on the US ISM Services PMI and Preliminary UoM Consumer Sentiment data due for release this week for fresh trading impetus in Gold price.

Also read: Gold Price Weekly Forecast: XAU/USD to attract additional buyers above $1,800

Gold Price: Key levels to watch

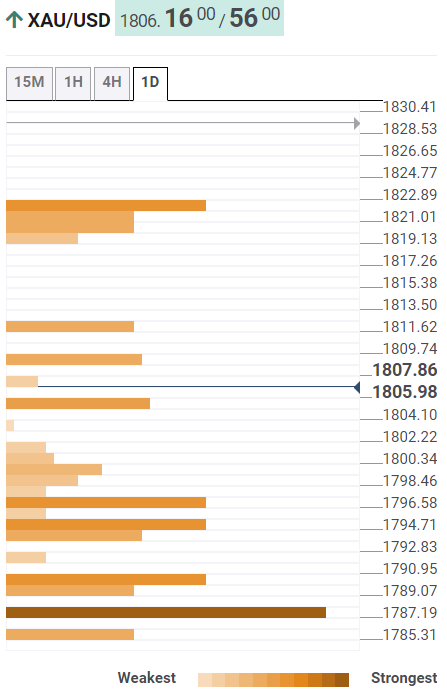
The Technical Confluence Detector shows that the gold price now looks to recapture the pivot point one-day R1 at $1,808.

A sustained move above the latter will put the Bollinger Band one-day Upper at $1,812 under threat.

Acceptance above the latter will fuel a fresh upswing toward the convergence of the pivot point one-week R1 and Fibonacci 161.8% one-day at $1,822.

Alternatively, the immediate support is seen at the previous day’s high of $1,805, below which the previous high four-hour at $1,799 will be challenged.

The SMA200 one-day at $1,797 will be the next downside target, a breach of the last will expose the Fibonacci 61.8% one-day at $1,794.

The line in the sand for Gold buyers is seen at the Fibonacci 23.6% one-week at $1,790.

Here is how it looks on the tool

fxsoriginal

About Technical Confluences Detector

The TCD (Technical Confluences Detector) is a tool to locate and point out those price levels where there is a congestion of indicators, moving averages, Fibonacci levels, Pivot Points, etc.  If you are a short-term trader, you will find entry points for counter-trend strategies and hunt a few points at a time. If you are a medium-to-long-term trader, this tool will allow you to know in advance the price levels where a medium-to-long-term trend may stop and rest, where to unwind positions, or where to increase your position size.

Share: Feed news

Information on these pages contains forward-looking statements that involve risks and uncertainties. Markets and instruments profiled on this page are for informational purposes only and should not in any way come across as a recommendation to buy or sell in these assets. You should do your own thorough research before making any investment decisions. FXStreet does not in any way guarantee that this information is free from mistakes, errors, or material misstatements. It also does not guarantee that this information is of a timely nature. Investing in Open Markets involves a great deal of risk, including the loss of all or a portion of your investment, as well as emotional distress. All risks, losses and costs associated with investing, including total loss of principal, are your responsibility. The views and opinions expressed in this article are those of the authors and do not necessarily reflect the official policy or position of FXStreet nor its advertisers. The author will not be held responsible for information that is found at the end of links posted on this page.

If not otherwise explicitly mentioned in the body of the article, at the time of writing, the author has no position in any stock mentioned in this article and no business relationship with any company mentioned. The author has not received compensation for writing this article, other than from FXStreet.

FXStreet and the author do not provide personalized recommendations. The author makes no representations as to the accuracy, completeness, or suitability of this information. FXStreet and the author will not be liable for any errors, omissions or any losses, injuries or damages arising from this information and its display or use. Errors and omissions excepted.

The author and FXStreet are not registered investment advisors and nothing in this article is intended to be investment advice.

Recommended content


Recommended content

Editors’ Picks

EUR/USD regains traction, recovers above 1.0700

EUR/USD regains traction, recovers above 1.0700

EUR/USD regained its traction and turned positive on the day above 1.0700 in the American session. The US Dollar struggles to preserve its strength after the data from the US showed that the economy grew at a softer pace than expected in Q1.

EUR/USD News

GBP/USD returns to 1.2500 area in volatile session

GBP/USD returns to 1.2500 area in volatile session

GBP/USD reversed its direction and recovered to 1.2500 after falling to the 1.2450 area earlier in the day. Although markets remain risk-averse, the US Dollar struggles to find demand following the disappointing GDP data.

GBP/USD News

Gold climbs above $2,340 following earlier drop

Gold climbs above $2,340 following earlier drop

Gold fell below $2,320 in the early American session as US yields shot higher after the data showed a significant increase in the US GDP price deflator in Q1. With safe-haven flows dominating the markets, however, XAU/USD reversed its direction and rose above $2,340.

Gold News

XRP extends its decline, crypto experts comment on Ripple stablecoin and benefits for XRP Ledger

XRP extends its decline, crypto experts comment on Ripple stablecoin and benefits for XRP Ledger

Ripple extends decline to $0.52 on Thursday, wipes out weekly gains. Crypto expert asks Ripple CTO how the stablecoin will benefit the XRP Ledger and native token XRP. 

Read more

After the US close, it’s the Tokyo CPI

After the US close, it’s the Tokyo CPI

After the US close, it’s the Tokyo CPI, a reliable indicator of the national number and then the BoJ policy announcement. Tokyo CPI ex food and energy in Japan was a rise to 2.90% in March from 2.50%.

Read more

Forex MAJORS

Cryptocurrencies

Signatures