Gold Price Forecast: XAU/USD bears pile in, threatening to crack the 50-DMA, eyeing $1830
- Gold price extended its losses in the session, down by 0.22%.
- The University of Michigan’s Consumer Sentiment improved, while inflation expectations jumped for 2023.
- Gold Price Forecast: Daily close below the 50-EMA could expose Gold to further selling pressure.

Gold price remains firm at around $1860 after hitting a week-to-date new low of $1852.45 on Friday due to speculations that the US Federal Reserve would raise rates by 25 bps in the next couple of meetings, as money market futures showed. A bid in the US Dollar and US Treasury bond yields reaching fresh 5-week highs capped Gold’s advancement. At the time of writing, XAU/USD is trading at $1858.68, above its opening price by 0.20%.
XAU/USD spiked toward its daily highs on US consumer sentiment
Wall Street continues to trade mixed, with the Nasdaq 100 being the outlier, losing more than 0.50%. A poll by the University of Michigan (UoM) reported that American Consumer Sentiment exceeded estimates of 65 and rose by 66.4, showing an improvement in financial conditions. Meanwhile, inflation expectations for a one-year horizon increased by 4.2% from 3.9% reported on January’s final reading, while for a 5-year horizon, it stood unchanged at 2.9%. XAU/USD’s reacted on the data, reaching as high as $1866.80, though retraced towards current prices.
Hawkish commentary by Fed officials, headwinds for XAU
Elsewhere a slew of Federal Reserve (Fed) officials during the week stated that more rate hikes are coming as the US central bank battles to curb inflation. New York Fed President John Williams commented on moving the Federal Funds rate (FFR) to 5%-5.25%. At the same time, Minnesota’s Fed President Neil Kashkari, a voter in the FOMC in 2023, said that the FFR needs to go as high as 5.4%.
Echoing some of their comments was Lisa D. Cook, who said that it’s appropriate to move in “smaller steps” while the Fed assesses the effects of cumulative tightening. Later the Richmond Fed President Thomas Barkin said that the Fed is “unequivocally” hitting the brakes on the economy.
Gold weakens as US Treasury bond yields and the USD rise
In the meantime, US Treasury bond yields continued to underpin the US Dollar (USD). The 10-year benchmark note rate is up six bps, at around weekly highs of 3.728%, a headwind for XAU’s prices. The US Dollar Index (DXY), which tracks the buck’s value vs. a basket of peers, advances 0.37% daily, up at 103.57.
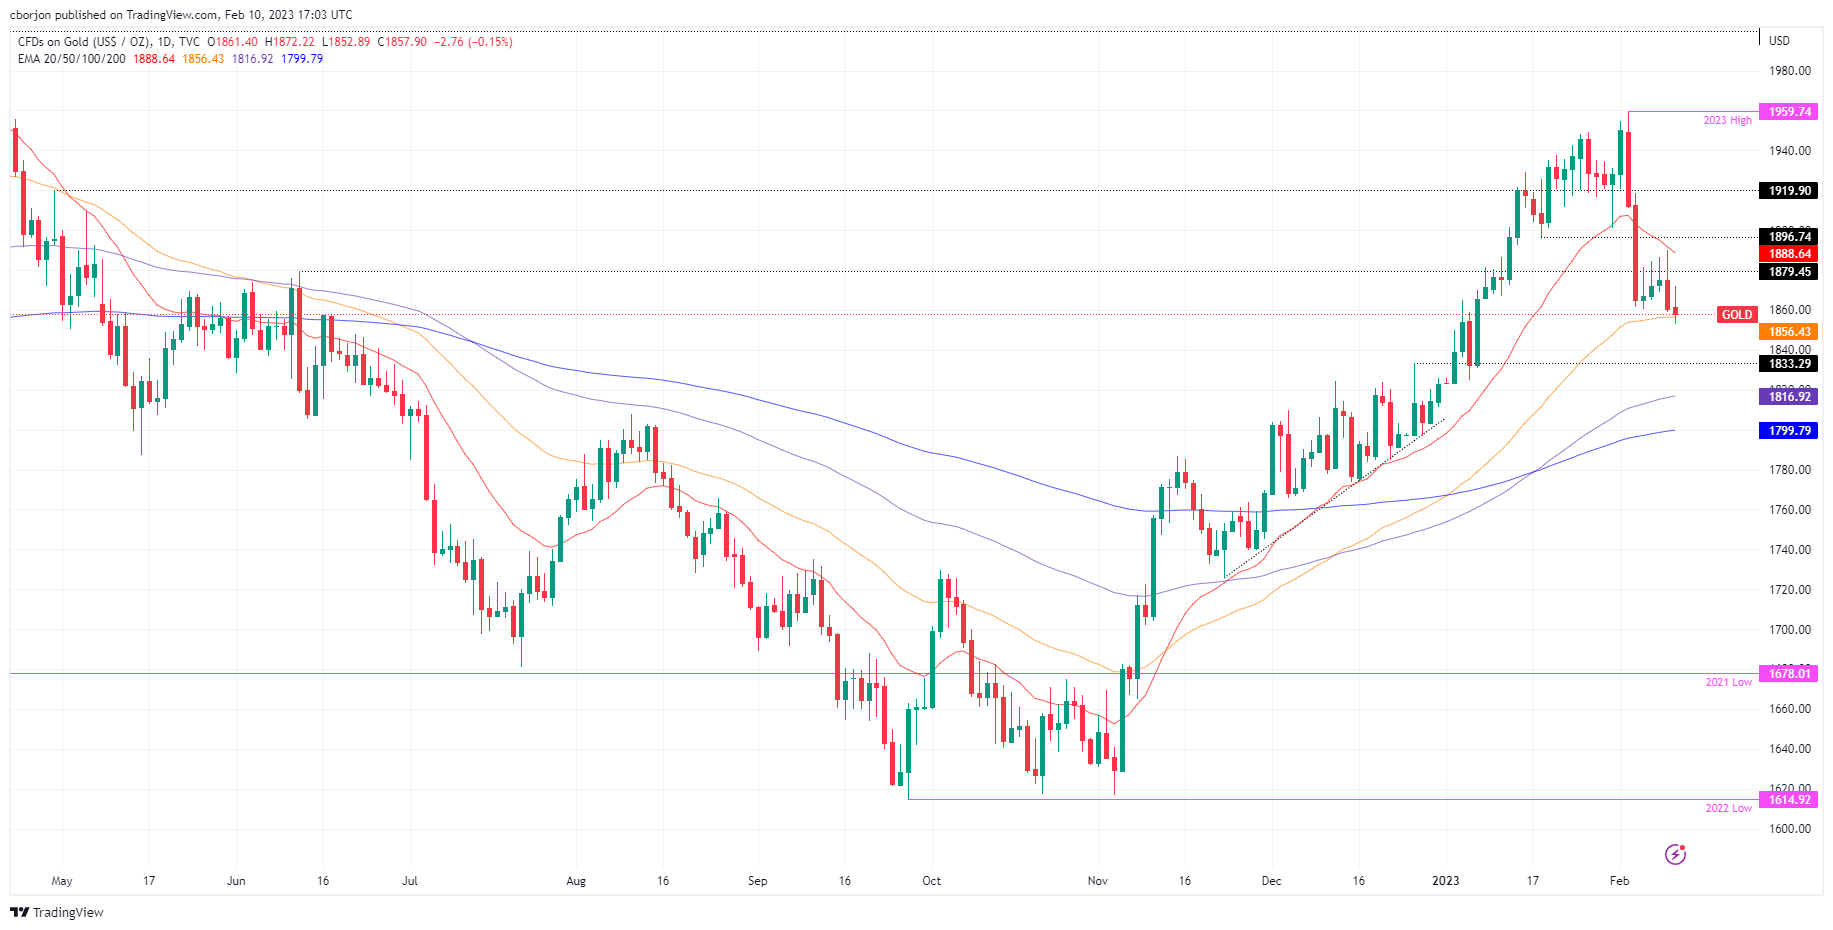
Gold technical analysis
XAU/USD’s daily chart portrays the yellow metal as neutral-to-downward biased, though the consolidation around $1860 and a subsequent break could pave the way for further losses. However, the 50-day Exponential Moving Average (EMA) at $1856.50 could cap Gold’s fall. Next support lies at the December 27 high-turned-support at $1833.29, followed by the 100-day EMA at $1816.91.
Author

Christian Borjon Valencia
FXStreet
Markets analyst, news editor, and trading instructor with over 14 years of experience across FX, commodities, US equity indices, and global macro markets.


