Gold Price Forecast: XAU/USD approaches March with sober face below $1,825 hurdle – Confluence Detector
- Gold price retreats towards intraday low amid sluggish session, stays on the way to first monthly loss in five.
- A pause in Treasury bond buying, mixed US-China headlines join hawkish Fed bets to keep XAU/USD sellers hopeful.
- Repeated failures to cross $1,825 resistance confluence tease Gold bears as March looms.

Gold price (XAU/USD) remains sluggish as traders brace for a quiet end to the volatile February, after an upbeat start to the week. The yellow metal’s latest weakness could be linked to the mixed concerns surrounding the US-China ties, as well as the unimpressive prints of the second-tier US data. However, hawkish Federal Reserve (Fed) concerns and upbeat US Treasury bond yields, despite the latest inaction, keep the Gold bears hopeful.
Also read: Gold Price Forecast: XAU/USD eyes daily close for Falling Wedge confirmation
Gold Price: Key levels to watch
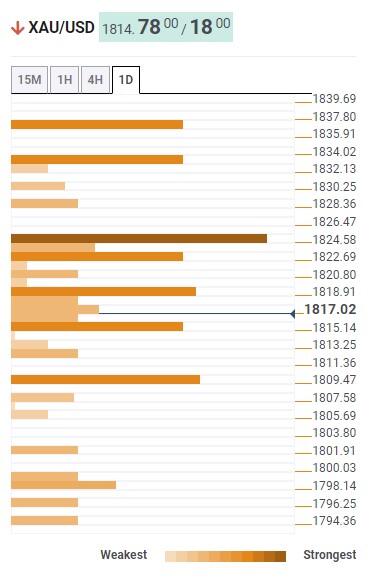
The Technical Confluence Detector shows that the Gold price grinds below the $1,825 resistance confluence which encompasses the Fibonacci 38.2% on one-week and the previous monthly low.
With this, the XAU/USD flirts with Fibonacci 38.2% on one-day, around $1,815, a break of which could quickly drag the metal prices towards $1,809 support level, including the previous weekly low and Pivot Point one-day S1.
In case where the Gold price remains weak past $1,809, there appears a smooth road towards $1,800 threshold comprising Pivot Point one-week S1 and Fibonacci 161% on one-day.
On the flip side, Fibonacci 23.6% on daily and Pivot Point one-day R1 guards immediate upside of the Gold price near $1,820 and $1,822, before highlighting the key $1,825 hurdle.
Should the XAU/USD price remains firmer past $1,825, a convergence of the 10-DMA and Fibonacci 61.8% on one-day, near $1,833, precedes the $1,838 hurdle including Pivot Point one-week R1 and one-day R3 to challenge the bulls.
Overall, the Gold price stays well-set to end February on a negative note.
Here is how it looks on the tool
About Technical Confluences Detector
The TCD (Technical Confluences Detector) is a tool to locate and point out those price levels where there is a congestion of indicators, moving averages, Fibonacci levels, Pivot Points, etc. If you are a short-term trader, you will find entry points for counter-trend strategies and hunt a few points at a time. If you are a medium-to-long-term trader, this tool will allow you to know in advance the price levels where a medium-to-long-term trend may stop and rest, where to unwind positions, or where to increase your position size.
Author

Anil Panchal
FXStreet
Anil Panchal has nearly 15 years of experience in tracking financial markets. With a keen interest in macroeconomics, Anil aptly tracks global news/updates and stays well-informed about the global financial moves and their implications.


