Gold Price Forecast: XAU/USD sticks to lows near $1,805 amid firmer US dollar
- Gold prices struggle to overcome the heaviest daily losses in a week, test short-term key support.
- Virus woes escalate and so do Fed-rate-hike concerns but year-end holiday mood restricts market moves.
- Second-tier US data, risk catalysts may entertain momentum traders around monthly top.
- Gold Price Forecast: Losing steam but holding above $1,800.00

Update: Gold price is consolidating the corrective pullback from one-month highs of $1,820 so far this Wednesday’s Asian trading. The bright metal sticks to lows just above the $1,800 mark, undermined by a broadly firmer US dollar amid a cautious market mood. Growing covid cases globally remains a cause for concern while the holiday-thinned trading conditions exacerbate the market’s pain, lifting the dollar’s safe-haven appeal. However, the losses appear capped by weaker Treasury yields and rising inflation expectations. The focus now shifts to the US Trade data and Pending Home Sales for fresh trading incentives, as the Omicron updates and Fed sentiment will continue to impact the dollar and gold valuations heading towards the New Year.
Read: 2022: The Year of (gold) inflation?
Gold (XAU/USD) remains pressured around $1,805 during Wednesday’s Asian session, after posting the biggest daily losses at five-week top.
The yellow metal took clues from the market’s indecision over the Fed’s next moves and worsening coronavirus conditions to reverse the gains near multiday high. Even so, thin end-of-year liquidity conditions challenge the bears even as the technical signals hint at the further downside of the yellow metal.
The UK reports the all-time high daily infections, above 122,000 a day after the authorities rejected any new activity restrictions during the rest of 2021. France joins the line with 179,807 new confirmed cases making it the world’s heaviest daily toll. Elsewhere, “The average number of new COVID-19 cases in the United States has risen 55% to over 205,000 per day over the last seven days,” according to a Reuters tally.
On the other hand, the US inflation expectations remain near the monthly high, per 10-Year Breakeven Inflation Rate numbers from the Federal Reserve Bank of St. Louis, which in turn keeps the hope of an early rate hike from the Fed on the table and weigh on gold prices.
Talking about data, US Housing Price Index eased below 1.2% forecast to 1.1% in October while S&P/Case-Shiller Home Price Indices stepped back from 19.5% prior to 18.4%, versus 18.5% market consensus. However, the Richmond Fed Manufacturing Index for December crossed the upwardly revised 12.00 figure with 16.00%.
Amid these plays, the US Treasury yields had a volatile day as a coupon for the two-year benchmark jumped to the highest since March 2020 but the 10-year Treasury yields remained lackluster around 1.48%, recently down to 1.477%.
It’s worth noting that Wall Street benchmarks traded volatile as DJI managed to print a five-day uptrend but S&P 500 snapped a four-day winning streak even after refreshing the record top during early hours. Nasdaq also closed negative for the first time in five days after poking the all-time high levels marked in November.
Considering the mixed markets and holiday mood, gold traders are likely to remain inactive. However, the latest rising wedge confirmation challenges the previous bullish consolidation. Hence, US Pending Home Sales and Goods Trade Balance for November, as well as risk catalysts, are important to watch for fresh impulse.
Technical analysis
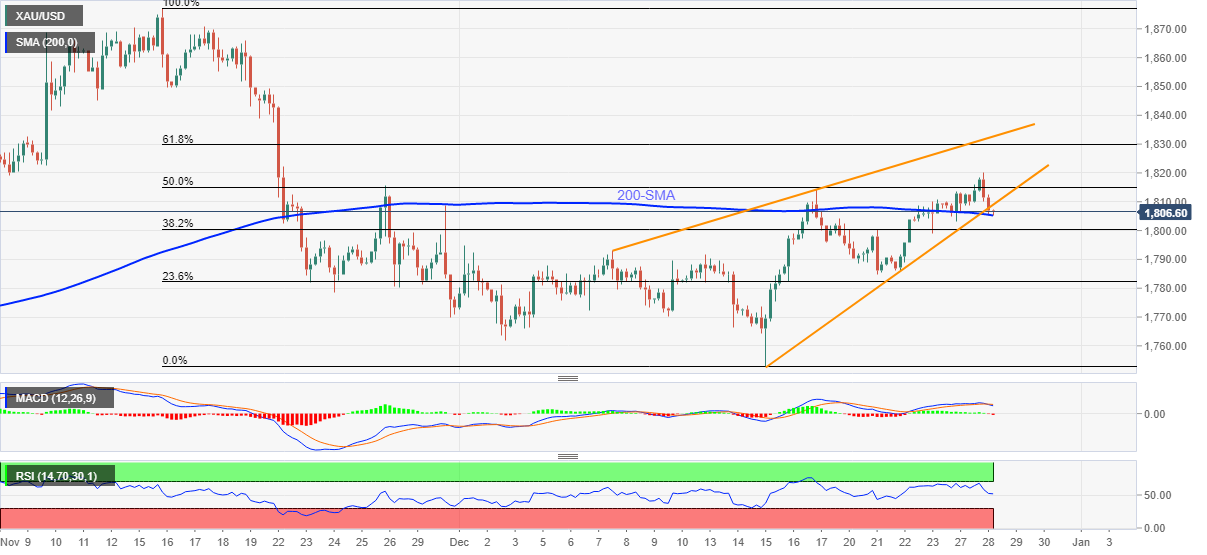
Gold prices confirmed a rising wedge bearish chart pattern the previous day on the four-hour play but the 200-SMA level near $1,805 probes the sellers.
Even so, bearish MACD signals and descending RSI line hint at the gold’s further weakness.
That said, the quote’s declines past $1,805 triggers a theoretical slump towards October’s low near $1,746. Though, the latest trough and the monthly bottom, respectively around $1,784 and $1,753, will challenge the metal’s further weakness.
Alternatively, gold buyers need to keep the reins beyond $1,810 to reject the latest bearish chart pattern confirmation.
Following that, the latest high near $1,820 and 61.8% Fibonacci retracement level of November-December downside, around $1,830, will gain the market’s attention.
Gold: Four-hour chart
Trend: Further weakness expected
Author

Anil Panchal
FXStreet
Anil Panchal has nearly 15 years of experience in tracking financial markets. With a keen interest in macroeconomics, Anil aptly tracks global news/updates and stays well-informed about the global financial moves and their implications.


