|premium|

Gold Price Forecast: Losing steam but holding above $1,800.00

XAU/USD Current price:  $1,811.22

  • US indexes flirt with record highs after more encouraging US macroeconomic data.
  • The US Richmond Fed Manufacturing Index improved from 11 to 16 in December.
  • XAU/USD retreated from a fresh one-month high, could turn bearish in the near term.

Spot gold reached an intraday high of $1,820.25 a troy ounce, its highest in over a month, later trimming gains. The American dollar met demand with Wall Street’s opening, helped by encouraging US data and subdued government bond yields. The Richmond Fed Manufacturing Index improved from 11 to 16 in December.  At the same time, US indexes kept rallying, with the S&P reaching a fresh record high and the DJIA nearing its all-time maximum.

The good mood has little backup, although market participants keep hoping the coronavirus Omicron variant may be the end of the pandemic, as it seems to be far less deadly than its precursors. Despite the record number of daily contagions, the death toll remains low, and the US and the UK have dismissed changes of new restrictions, at least in the near term.

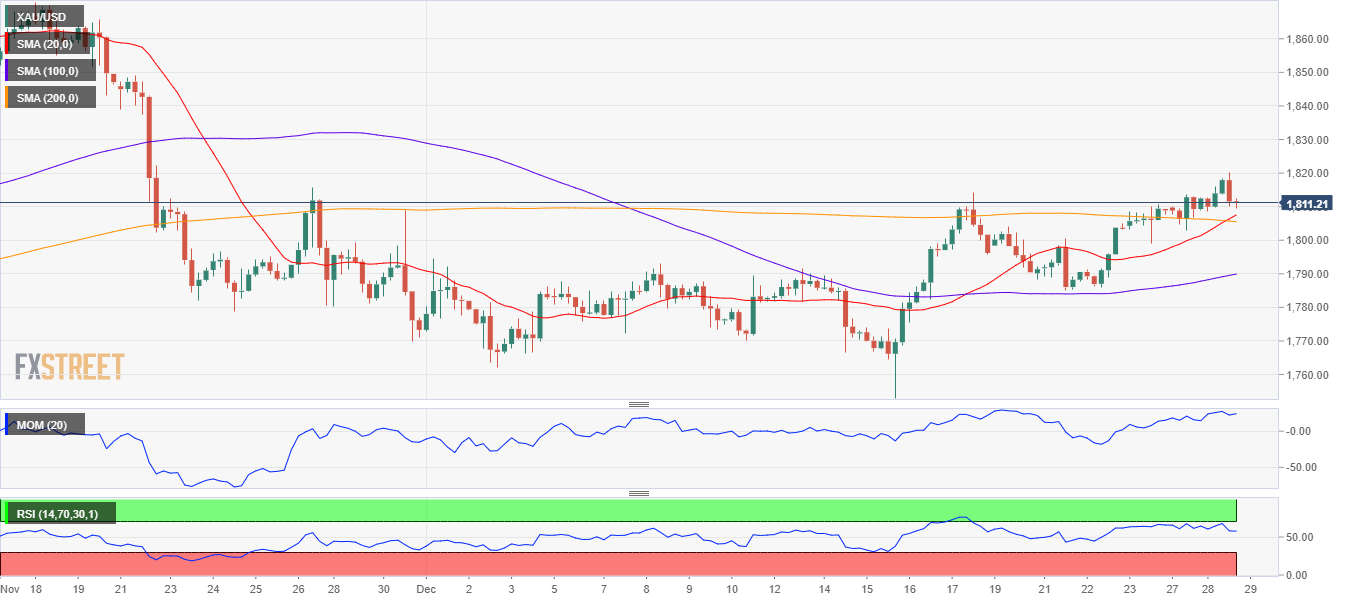
Gold price short-term technical outlook

The daily chart for the XAU/USD pair shows that it may change course in the upcoming sessions, as the daily candle shows a long upper wick, following a three-day rally. In the mentioned time frame, the bright metal continues to develop above a congestion of directionless moving averages, while technical indicators are flat just above their midlines.

In the near term, and according to the 4-hour chart, gold is losing bullish steam, not yet confirming a bearish continuation. The 20 SMA is crossing above a flat 200 SMA, both in the 1,806 price zone, while the 100 SMA maintains a modest bullish slope at around 1,787. In the meantime, technical indicators continue retreating within positive levels with limited directional strength. The bearish case will be firmer on a break below 1,803.00, the immediate support level.

Support levels: 1,803.00 1,791.80 1,782.10  

Resistance levels: 1,814.20 1,822.90 1,832.75

View Live Chart for the XAU/USD

Premium

You have reached your limit of 3 free articles for this month.

Start your subscription and get access to all our original articles.

Subscribe to PremiumSign In

Author

Valeria Bednarik

Valeria Bednarik was born and lives in Buenos Aires, Argentina. Her passion for math and numbers pushed her into studying economics in her younger years.

More from Valeria Bednarik
Share:

Editor's Picks

EUR/USD holds above 1.1750 after mixed EU PMI data

EUR/USD manages to hold above 1.1750 but struggles to gather recovery momentum on Friday, following the mixed February PMI figures from Germany and the Eurozone. In the second half of the day, Q4 GDP, December inflation and February PMI data from the US will be watched closely by market participants.

GBP/USD recovers further toward 1.3500 after UK PMI data

GBP/USD is recovering ground further toward 1.3500 in European trading on Friday, helped by a modest uptick in the Pound Sterling after stronger-than-expected UK January Retail Sales and February PMI data. However, the pair's further upside could be limited amid persistent US Dollar strength as the focus turns to key US data. 

Gold sticks to positive bias above $5,000 ahead of US data

Gold gains some positive traction for the third consecutive day on Friday. holding above $5,000. Traders now look forward to the key US macro releases – the Advance Q4 GDP report and the Personal Consumption Expenditures (PCE) Price Index – for fresh trading impetus. 

US GDP growth expected to slow down significantly in Q4 after stellar Q3 

The United States Bureau of Economic Analysis will publish the first preliminary estimate of the fourth-quarter Gross Domestic Product at 13:30 GMT. Analysts forecast the US economy to have expanded at a 3% annualized rate, slowing down from the 4.4% growth posted in the previous quarter.

Iran tensions and AI fears at the forefront ahead of key US data

Thursday’s scorecard shows major US Stock benchmarks closed modestly in the red amid mounting US-Iran tensions and AI disruption worries. The S&P 500 shed 19 points (0.3%) to 6,861, the Nasdaq 100 lost 101 points (0.4%) to 24,797, and the Dow Jones Industrial Average dropped 267 points (0.5%) to 49,395.

Official Trump price approaches breakout with mixed signals from traders

Official Trump (TRUMP) is trading at $3.50 at the time of writing, approaching its upper consolidation range. A breakout from this range could open the door for an upside move. On-chain data shows market indecision, with balanced flows between bulls and bears, signaling a lack of clear directional bias.