Gold Price Analysis: XAU/USD’s path of least resistance appears down, eyes on Powell, Biden – Confluence Detector

Gold (XAU/USD) is licking its wounds after tumbling $20 in a quick move earlier in the Asian trades. Reports that a bigger-than-expected US stimulus plan worth $2 trillion is due to be announced by President-elect Joe Biden knocked-off the US Treasuries, fuelling a rebound in the US dollar and Treasury yields.
The expectations of a higher US fiscal stimulus plan are likely to keep the bounce in the Treasury yields intact. Therefore, the risks remain skewed to the downside in gold in the lead up to the US weekly jobs data and the Fed Chair Powell’s speech. Although a bounce cannot be ruled out after the sharp move to the downside.
Technically, gold faces healthy resistance levels, which again makes the downside more compelling.
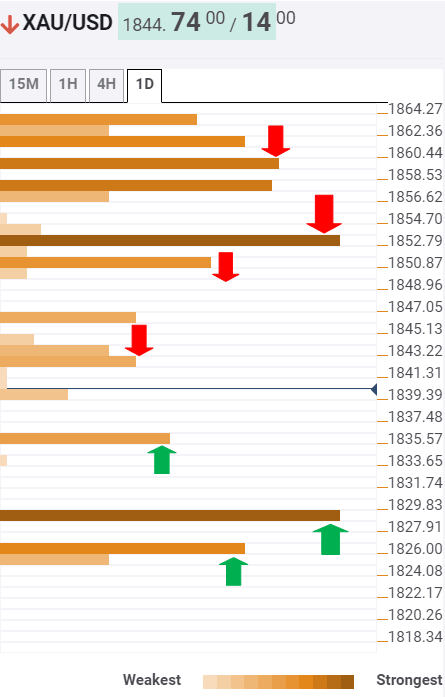
Gold Price Chart: Key resistances and supports
The Technical Confluences Indicator shows that gold sees major support at $1836, the convergence of the pivot point one-day S2 and Bollinger Band four-hour Lower.
The next powerful support awaits at $1828, which is the confluence of the previous week low, previous low on four-hour and Bollinger Band one-day Lower.
A failure to resist above the last could put the $1825 support at risk. That level is the intersection of the Fibonacci 61.8% one-month and pivot point one-day S3.
On the flip side, immediate resistance is seen around $1842, where a dense cluster of hurdles is lined up. It is the confluence zone of the SMA200 one-day, pivot point one-day S1 and previous high one-hour.
The buyers will then target the $1850 barrier, where the Fibonacci 23.6% one-day lies.
Further up, a relevant barrier at $1853 is likely to be a tough nut to crack for the XAU bulls. It’s the meeting point of the previous high four-hour and Fibonacci 38.2% one-day.
The further upside is going to be an uphill task for the bulls, with multiple strong hurdles in the way towards the $1860 level. The Fibonacci 23.6% one-week coincides with the pivot point one-day R1 at the latter.
Here is how it looks on the tool
About Confluence Detector
The TCI (Technical Confluences Indicator) is a tool to locate and point out those price levels where there is a congestion of indicators, moving averages, Fibonacci levels, Pivot Points, etc. Knowing where these congestion points are located is very useful for the trader, and can be used as a basis for different strategies.
Author

Dhwani Mehta
FXStreet
Residing in Mumbai (India), Dhwani is a Senior Analyst and Manager of the Asian session at FXStreet. She has over 10 years of experience in analyzing and covering the global financial markets, with specialization in Forex and commodities markets.


