Gold Price Analysis: XAU/USD's love affair with bullish trendline continues


  • Gold trades around a multi-month bullish trendline for the ninth straight day. 
  • The Sept. 8 low is now the level to beat for the bears. 

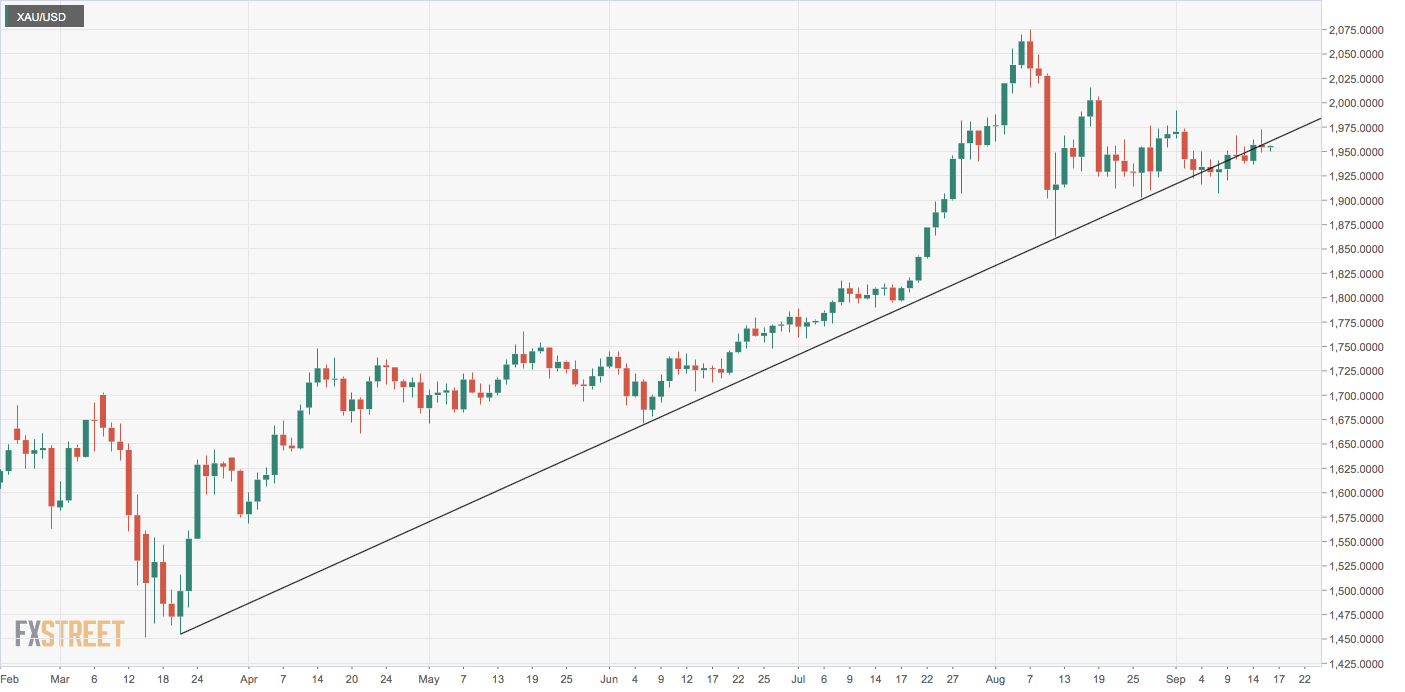
Gold is flirting with a six-month-rising trendline for the ninth consecutive trading day. 

At press time, the metal is trading just short of the ascending trendline at $1,956. The safe-haven metal hit a low of $1,906.80 on Sept. 8 and rose to a high of $1,972 on Tuesday. 

However, throughout the recovery rally, the bulls have persistently struggled to establish a foothold above the trendline hurdle. Meanwhile, bears have had a tough capitalizing on the occasional bull failure at the trendline hurdle. For instance, the ascending trendline was breached on Sept. 8 and Sept. 11. However, on both occasions, the follow-through was bullish. 

As such, the trendline is no longer relevant for technical traders, and key levels to watch out for are the Sept. 15 high of $1,972 and Sept. 8 low of $1,906.80. 

A close above $1,972 would invalidate the bearish lower highs on the daily chart and signal a broader bull trend revival. Alternatively, a close below  $1,906 would imply a bearish reversal. 

Daily chart

Trend: Neutral

Technical levels

XAU/USD

Overview
Today last price 1955.4
Today Daily Change 1.17
Today Daily Change % 0.06
Today daily open 1954.23
 
Trends
Daily SMA20 1943.52
Daily SMA50 1926.25
Daily SMA100 1828.95
Daily SMA200 1707.49
 
Levels
Previous Daily High 1972.23
Previous Daily Low 1948.48
Previous Weekly High 1966.54
Previous Weekly Low 1906.62
Previous Monthly High 2075.32
Previous Monthly Low 1863.24
Daily Fibonacci 38.2% 1957.55
Daily Fibonacci 61.8% 1963.16
Daily Pivot Point S1 1944.4
Daily Pivot Point S2 1934.56
Daily Pivot Point S3 1920.65
Daily Pivot Point R1 1968.15
Daily Pivot Point R2 1982.06
Daily Pivot Point R3 1991.9


Share: Feed news

Information on these pages contains forward-looking statements that involve risks and uncertainties. Markets and instruments profiled on this page are for informational purposes only and should not in any way come across as a recommendation to buy or sell in these assets. You should do your own thorough research before making any investment decisions. FXStreet does not in any way guarantee that this information is free from mistakes, errors, or material misstatements. It also does not guarantee that this information is of a timely nature. Investing in Open Markets involves a great deal of risk, including the loss of all or a portion of your investment, as well as emotional distress. All risks, losses and costs associated with investing, including total loss of principal, are your responsibility. The views and opinions expressed in this article are those of the authors and do not necessarily reflect the official policy or position of FXStreet nor its advertisers. The author will not be held responsible for information that is found at the end of links posted on this page.

If not otherwise explicitly mentioned in the body of the article, at the time of writing, the author has no position in any stock mentioned in this article and no business relationship with any company mentioned. The author has not received compensation for writing this article, other than from FXStreet.

FXStreet and the author do not provide personalized recommendations. The author makes no representations as to the accuracy, completeness, or suitability of this information. FXStreet and the author will not be liable for any errors, omissions or any losses, injuries or damages arising from this information and its display or use. Errors and omissions excepted.

The author and FXStreet are not registered investment advisors and nothing in this article is intended to be investment advice.

Recommended content


Recommended content

Editors’ Picks

EUR/USD trades with negative bias, holds above 1.0700 as traders await US PCE Price Index

EUR/USD trades with negative bias, holds above 1.0700 as traders await US PCE Price Index

EUR/USD edges lower during the Asian session on Friday and moves away from a two-week high, around the 1.0740 area touched the previous day. Spot prices trade around the 1.0725-1.0720 region and remain at the mercy of the US Dollar price dynamics ahead of the crucial US data.

EUR/USD News

USD/JPY jumps above 156.00 on BoJ's steady policy

USD/JPY jumps above 156.00 on BoJ's steady policy

USD/JPY has come under intense buying pressure, surging past 156.00 after the Bank of Japan kept the key rate unchanged but tweaked its policy statement. The BoJ maintained its fiscal year 2024 and 2025 core inflation forecasts, disappointing the Japanese Yen buyers. 

USD/JPY News

Gold price flatlines as traders look to US PCE Price Index for some meaningful impetus

Gold price flatlines as traders look to US PCE Price Index for some meaningful impetus

Gold price lacks any firm intraday direction and is influenced by a combination of diverging forces. The weaker US GDP print and a rise in US inflation benefit the metal amid subdued USD demand. Hawkish Fed expectations cap the upside as traders await the release of the US PCE Price Index.

Gold News

Sei Price Prediction: SEI is in the zone of interest after a 10% leap

Sei Price Prediction: SEI is in the zone of interest after a 10% leap

Sei price has been in recovery mode for almost ten days now, following a fall of almost 65% beginning in mid-March. While the SEI bulls continue to show strength, the uptrend could prove premature as massive bearish sentiment hovers above the altcoin’s price.

Read more

US core PCE inflation set to signal firm price pressures as markets delay Federal Reserve rate cut bets

US core PCE inflation set to signal firm price pressures as markets delay Federal Reserve rate cut bets

The core PCE Price Index, which excludes volatile food and energy prices, is seen as the more influential measure of inflation in terms of Fed positioning. The index is forecast to rise 0.3% on a monthly basis in March, matching February’s increase. 

Read more

Forex MAJORS

Cryptocurrencies

Signatures