|

Gold Price Analysis: XAU/USD turns vulnerable below ascending trend-line support

  • Gold extended the previous day’s rejection slide from the $1875-76 supply zone.
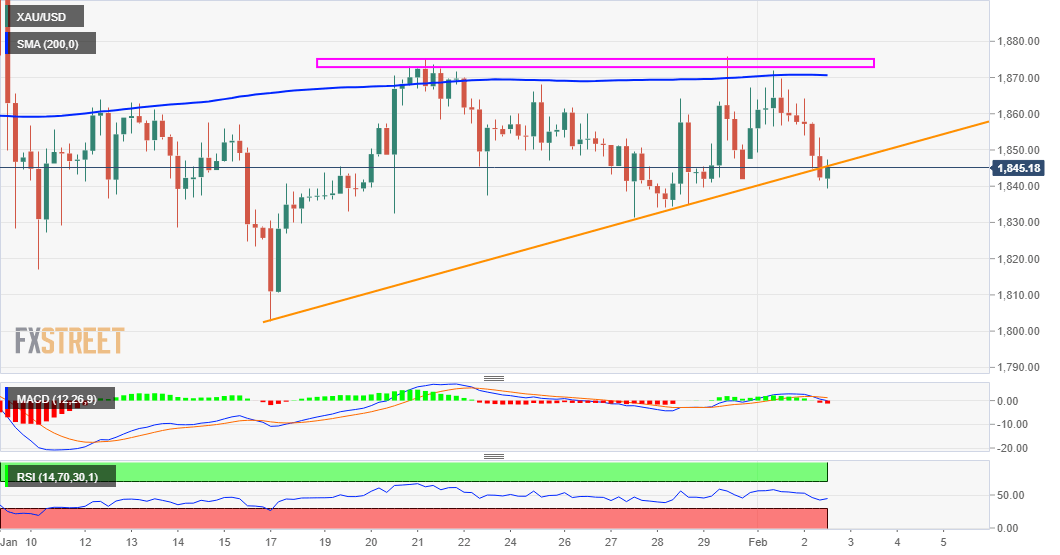
  • Break below two-week-old ascending trend-line sets the stage for further decline.
  • The metal now seems vulnerable to slide below the $1830 intermediate support.

Gold continued losing ground through the mid-European session and dropped to three-day lows, around the $1840-39 region in the last hour.

Against the backdrop of the upbeat market mood, a sudden pick up in the US dollar demand exerted some additional downward pressure on the dollar-denominated commodity. The latest leg down dragged the XAU/USD below a two-week-old ascending trend-line support.

Given the overnight failure near the $1875-76 barrier, the breakdown might have already set the stage for further weakness. The negative outlook is reinforced by the fact that oscillators on 4-hourly/daily charts have just started drifting into the bearish territory.

Hence, a subsequent slide towards intermediate support, around the $1830 horizontal zone, looks a distinct possibility. The downward trajectory could further get extended back towards challenging January monthly swing lows, around the $1800 round-figure mark.

On the flip side, the $1857-60 region now act as immediate resistance. Any further positive move might continue to meet with some fresh supply and remain capped near the $1875-76 supply zone. Only a sustained breakthrough will negate the near-term bearish bias.

The XAU/USD might then aim to reclaim the $1900 mark and appreciate towards the $1922-24 resistance zone. Some follow-through buying has the potential to lift the commodity further towards the next major hurdle near the $1960 region.

XAU/USD 4-hourly chart

fxsoriginal

Technical levels to watch

XAU/USD

Overview
Today last price1844
Today Daily Change-14.96
Today Daily Change %-0.80
Today daily open1858.96
 
Trends
Daily SMA201860.72
Daily SMA501856.84
Daily SMA1001877.15
Daily SMA2001851.82
 
Levels
Previous Daily High1871.9
Previous Daily Low1847.54
Previous Weekly High1875.7
Previous Weekly Low1831.36
Previous Monthly High1959.42
Previous Monthly Low1802.8
Daily Fibonacci 38.2%1862.59
Daily Fibonacci 61.8%1856.85
Daily Pivot Point S11847.03
Daily Pivot Point S21835.11
Daily Pivot Point S31822.67
Daily Pivot Point R11871.39
Daily Pivot Point R21883.83
Daily Pivot Point R31895.75

Author

Haresh Menghani

Haresh Menghani is a detail-oriented professional with 10+ years of extensive experience in analysing the global financial markets.

More from Haresh Menghani
Share:

Editor's Picks

AUD/USD falls to near 0.7100 after slipping below 50-day EMA

AUD/USD depreciates after registering minor gains in the previous day, trading around 0.7120 during the Asian hours. The technical analysis of the daily chart shows the pair consolidating sideways within a rectangle pattern, as neither bulls nor bears gain control. The AUD/USD pair is holding a slight bearish tone however as it sits beneath both the nine-day and 50-day EMAs.

160.00: USD/JPY back near intervention territory after upbeat US jobs report

US Nonfarm Payrolls beat expectations by a wide margin in May, with 172K jobs added. The US Dollar rebounds after the release, helping USD/JPY recover from its intraday lows. Warnings from Japanese authorities continue to limit upside potential near the 160.00 threshold.

Gold targets $4,300 amid stronger Dollar

Gold faces increasing selling interest and navigates the area of three-month lows near the $4,300 mark per troy ounce on Friday. The precious metal’s decline comes as traders assess the stronger-than-expected NFP, while the bid bias in the Greenback and higher US Treasury yields also collaborate with the retracement.

Cardano hits five-year low even as Hoskinson clarifies "break" isn't an exit

Cardano (ADA) price is down 10% at press time on Friday, extending losses over 30% so far this week amid Charles Hoskinson's clarification that "break" isn't an exit.

Week ahead – Fed countdown begins amid US inflation data and geopolitical risks

Fed Chair Warsh’s first meeting approaches as key US inflation data could reshape expectations. Oil prices remain elevated as US-Iran talks continue; tariffs also return to the spotlight. ECB is expected to hike; will it be a one-off move or is July live?

The US economy defies the rules: 100 days into the Oil shock and the recession signal is still missing

More than three months after the start of the Iran war and the resulting disruption to global energy markets, the US economy continues to display remarkable resilience. The conflict has triggered a sharp rise in Oil prices, reignited inflationary pressures and fueled widespread concerns about a potential economic slowdown.