Gold Price Analysis: XAU/USD to face stiff resistance at $1722 on the road to recovery – Confluence Detector

Gold (XAU/USD) is struggling to extend its recovery momentum above $1700, as the US dollar clings onto the recent upside amid a cautious market mood. Gold, however, finds support from retreating US Treasury yields, as uncertainty around the passing of President Joe Biden’s $2 trillion infrastructure plan.
Surging covid cases and fresh lockdowns in Europe could dent the risk appetite, which could lift the haven bids for the US dollar at gold’s expense. Focus shifts to the US jobless claims and ISM Manufacturing PMI ahead of Friday’s critical NFP report.
How is gold positioned on the technical charts?
Gold Price Chart: Key resistance and support levels
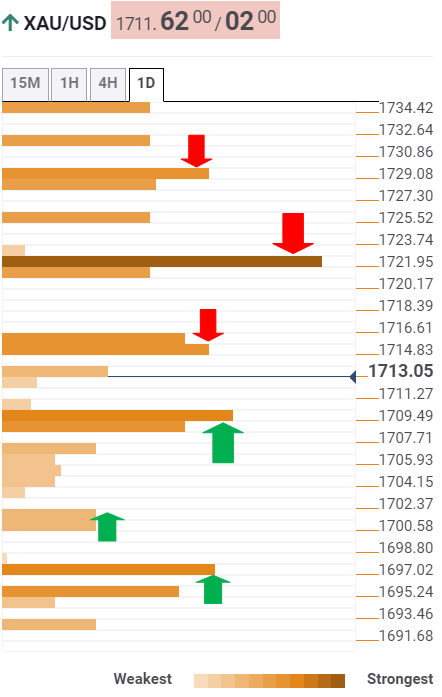
The Technical Confluences Detector shows that gold meets initial demand at $1715, which is the convergence of the previous day high and Bollinger Band 15-minutes Upper.
The XAU bulls need to clear the powerful $1722 resistance to unleash any meaningful recovery from multi-week troughs. That level is the intersection of the previous week low, SMA50 four-hour and SMA200 one-hour.
The next upside barrier aligns at $1725, where the SMA10 one-day coincides with the SMA100 four-hour.
Further up, the Fibonacci 61.8% one-month at $1730 would challenge the bullish commitments.
On the flip side, fierce support awaits at $1708, the confluence of the Fibonacci 38.2% one-month, pivot point one-week S2 and SMA100 one-hour.
If the selling pressure intensifies, a test of the Fibonacci 38.2% one-day at $1701 could be on the bears’ radars.
Further south, defending the Fibonacci 23.6% one-month at $1697 would be critical for the XAU bulls.
Here is how it looks on the tool
About Technical Confluences Detector
The TCD (Technical Confluences Detector) is a tool to locate and point out those price levels where there is a congestion of indicators, moving averages, Fibonacci levels, Pivot Points, etc. Knowing where these congestion points are located is very useful for the trader, and can be used as a basis for different strategies.
Author

Dhwani Mehta
FXStreet
Residing in Mumbai (India), Dhwani is a Senior Analyst and Manager of the Asian session at FXStreet. She has over 10 years of experience in analyzing and covering the global financial markets, with specialization in Forex and commodities markets.


