Gold Price Analysis: XAU/USD stabilises ahead of bombardment of Fed speak and key US data next week
- Spot gold prices are consolidating in the low $1740s, close the 21DMA which currently resides just above $1740.
- Next week, gold’s key drivers will be a bombardment of Fed speak, preliminary Markit PMIs and Core CPE inflation.

Spot gold prices (XAU/USD) are consolidating in the low $1740s, close the 21-day moving average which currently resides just above $1740. Prices have been generally well supported above the $1730 level, amid a lack of any real fundamental drivers throughout the day, as well as relatively subdued price action in FX markets (USD is flat) and bond markets (US 10-year bond yields are flat). On the day, it looks as though gold will close with gains of around a quarter of a percent or roughly $5, which translated into modest gains on the week of around 0.8% or just under $15.
Next week, the key fundamental drivers of gold will be a bombardment of Fed speak, including from Fed Chair Jerome Powell who speaks on three separate occasions, as well as comments from Fed Vice Chairman Richard Clarida and NY Fed President John Williams. US data in the form of the timely preliminary Markit PMI report for the month of March (out on Wednesday) and February Core PCE inflation data (the Fed’s favoured gauge of inflation will also be worth watching. Ultimately, what happens with USD and real yields is likely to determine where gold goes; if both continue to rise, that could spell pain for gold, though if inflation expectations keep surging, this could be supportive.
Technical observations
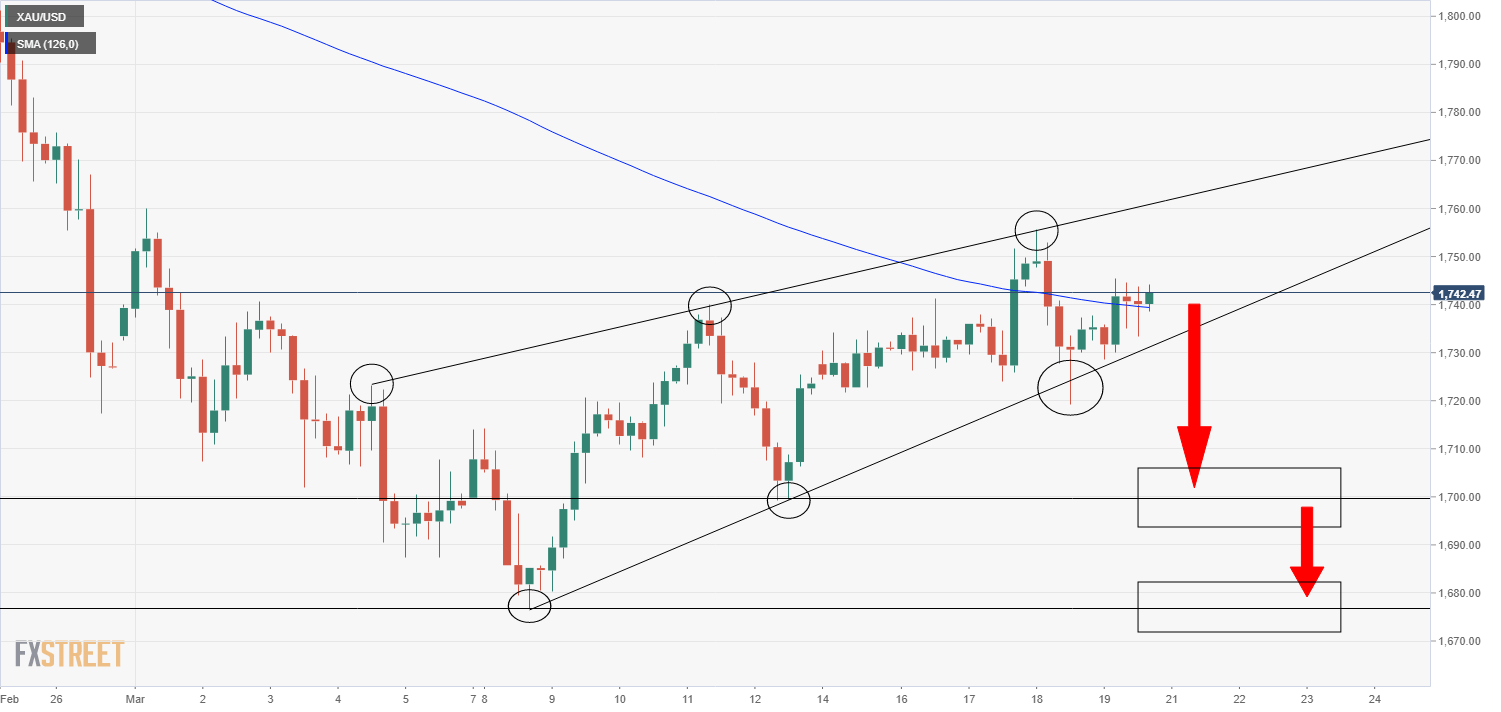
This week’s price action has confirmed that spot gold is consolidating within a bearish flag; to the upside, an uptrend linking the 4, 11 and 18 March highs has been constraining the price action, whilst to the downside, an uptrend linking the 5, 12 and 18 March lows has been supporting the price action. Typically, such structures occur when an asset is consolidating following recent losses, with a break to the downside of the flag acting as the sell signal for further downside – such a sell signal could be triggered by a break below the $1720-$1730 area and could open the door to a drop all the way back towards the psychologically important $1700 level and an eventual drop back to monthly lows around $1680.
XAU/USD four hour chart
Author

Joel Frank
Independent Analyst
Joel Frank is an economics graduate from the University of Birmingham and has worked as a full-time financial market analyst since 2018, specialising in the coverage of how developments in the global economy impact financial asset


