Gold Price Analysis: XAU/USD rallies back closer to multi-month tops, around $1,840 region
- Gold could be on the verge of a lower low, but the hourly time frame is key.
- The hourly support structure is guarding a break to test bullish commitments at 1,800.
- The 10-day EMA and confluence of the 50% mean reversion are also offering support.
-
Gold Weekly Forecast: XAU/USD could target 200-day SMA

Update: Gold continued scaling higher through the early European session and jumped to the $1,840 level in the last hour, back closer to near three-month tops touched earlier this week. A combination of factors assisted the commodity to build on the previous day's rebound from one-week lows and gain strong positive traction on the last trading day of the week.
The ongoing downfall in the US Treasury bond yields failed to assist the US dollar to capitalize on this week's positive move inspired by a red-hot US CPI report. This, in turn, was seen as a key factor that drove flows towards the non-yielding yellow metal. The already weaker USD lost some additional ground following the disappointing release of the US monthly Retail Sales figures for April. This further acted as a tailwind for dollar-denominated commodities, including gold.
The strong intraday positive move seemed rather unaffected by a strong opening in the US equity markets, which tends to undermine demand for the traditional safe-haven gold. It will now be interesting to see if bulls are able to capitalize on the move or the XAU/USD continues with its struggle to break through the very important 200-day SMA barrier, currently near the $1,849-50 region.
Update: The offered tone strengthened around the US dollar in the European session, driving the gold price towards the $1840 level. The extension of the declines in the US Treasury yields could be seen as a catalyst behind the dollar’s fresh leg down. Profit-taking on USD longs also collaborated with gold’s latest advance.
The gold price is building onto Thursday’s day rebound and eyes the horizontal trendline (orange) resistance on the hourly chart, which is placed around the $1840 mark. A bullish crossover and Relative Strength Index (RSI) add credence to a potential move higher. However, the US Retail Sales and Consumer Sentiment data will determine the next direction in the dollar, which will eventually have a significant impact on gold.
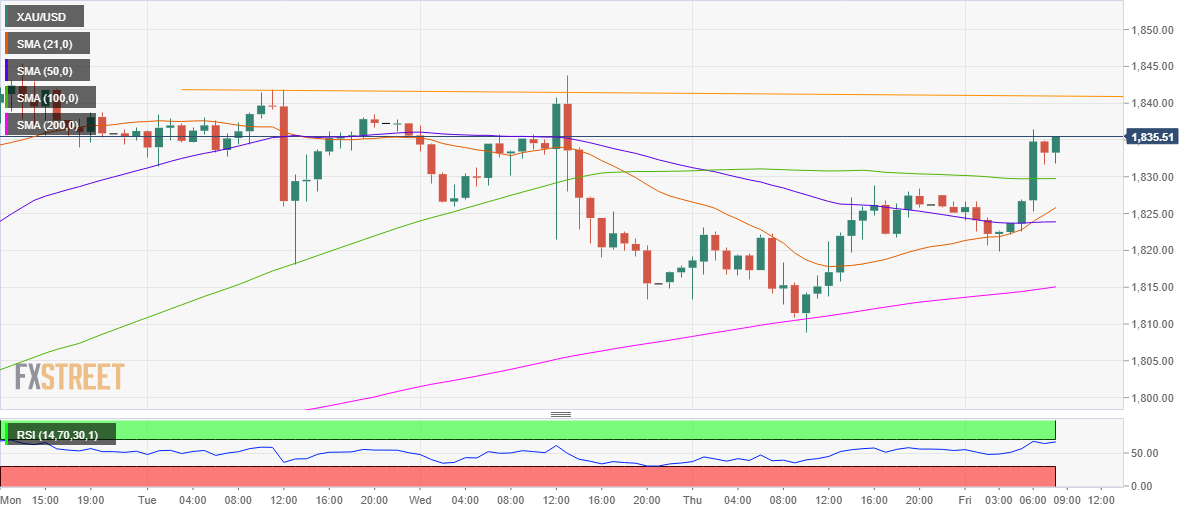
Gold Price Chart: One-hour
Update: Gold reversed an Asian session dip to the $1,820 area and turned positive for the second consecutive day, with bulls now looking to build on the overnight bounce from one-week lows. The US dollar struggled to capitalize on a red-hot US CPI report-inspired positive move and was being pressured by retreating US Treasury bond yields. This was seen as a key factor that extended some support to the dollar-denominated commodity.
That said, a generally positive tone around the equity markets might act as a headwind for traditional safe-haven assets and cap any meaningful upside for gold. The global risk sentiment got a goodish lift after a slew of officials reiterated that price pressures from the reopening of the economy would prove transitory.
Market participants now look forward to the release of US monthly Retail Sales figures for guidance on whether the upward pressure on prices will persist. This will play a key role in driving the Fed rate expectations and provide a fresh directional impetus to the non-yielding yellow metal.
Update: Gold (XAU/USD) extends the previous day’s losses to early Friday, down 0.10% to $1,823 by the press time. In doing so, gold traders ignore the mildly bid S&P 500 Futures and soft US dollar while taking clues from the US 10-year Treasury yields.
Behind the moves could be the mixed play between the coronavirus (COVID-19) woes in Japan and India, recently in the UK, as well as the US optimism backed by the firm inoculation. It should, however, be noted that the gold traders’ indecision could be traced to the Fed’s sustained rejection to policy adjustments despite recently cited reflation fears, not to forget strong US Jobless Claims versus downbeat Nonfarm Payrolls.
Moving on, cautious sentiment is likely to weigh on the gold prices as traders await the US Retail Sales for April, as well as the preliminary readings of the Michigan Consumer Sentiment Index for May.
Gold (XAU/USD) struggles to extend Thursday’s recovery moves around $1,830 amid the initial Asian session on Friday. The gold buyers are recently probed amid escalating geopolitical tension in the Middle East, as well as rising fears of the Indian variant of covid.
On Thursday, gold bounced off a weekly low following the upbeat US Jobless Claims and the Federal Reserve (Fed) policymakers’ strong defense to the easy money, not ignore a light calendar elsewhere. Furthermore, the US Centers for Disease Control and Prevention (CDC) push for no mask-mandate for fully vaccinated people also backed the gold bulls the previous day.
Amid these plays, Wall Street benchmarks marked the first positive day of the week while the US 10-year Treasury yields eased to 1.64%, down 4.4 basis points (bps) by the end of Thursday’s US session. Following that, S&P 500 Futures stays pressured amid fresh hurdles for the risk-on mood.
It should, however, be noted that the latest challenges to the sentiment join the pre-US Retail Sales caution and a light calendar in Asia to probe gold traders, which in turn signals a choppy ahead of the North American session.
Gold is trading around 0.57% higher on the day as the price firms from a technical confluence area of support on both the daily and hourly time frames.
XAU/USD has travelled from a low of $1,808.86 to a high of $1,828.83 so far on the day.
The greenback remains firm around the highs for the week due to a double whammy of inflation data that is giving the market some fresh concerns.
Firstly, the Consumer Price Index from the prior day lifted US yields when US consumer prices increased by the most in nearly 12 years in April.
Then, on Thursday, the US Labor Department reported higher producer prices in April, further evidence that inflation is rising in the United States.
The Producer Price Index rose 0.6% in April after surging 1.0% in March. In the 12 months through April, the PPI shot up 6.2%. That was the biggest year-on-year rise since the series was revamped in 2010 and followed a 4.2% jump in March.
Markets are now betting that the Federal Reserve could raise interest rates sooner than the bank has forecast.
However, the US Federal Reserve Vice Chair Richard Clarida said that weak job growth and strong inflation in April will not have altered any monetary policy plans at the Fed.
''Yesterday's inflation print fed into the market's fear of runaway prices, with a chorus of investors expecting the Fed's uber-dovish stance, combined with a massive global fiscal thrust, to translate into a policy mistake sparking a sharp overshoot,'' analysts at TD Securities have explained.
''In this sense, it is worth highlighting that gold is underperforming against periods of high inflation. CTA short covering has helped prices nudge higher but the yellow metal will struggle to follow-through without further support from real rates.''
Finally, the analysts warned that they ''estimate algorithmic trend followers could potentially be whipsawed should prices close below $1775/oz, particularly as the Indian lockdown saps appetite for physical metal.''
Gold technical analysis
Meanwhile, from a technical stance, the gold price has moved in on the 10-day EMA within the solid uptrend and could still attract buyers in what would be a correction of the prior weekly and daily bullish impulse.
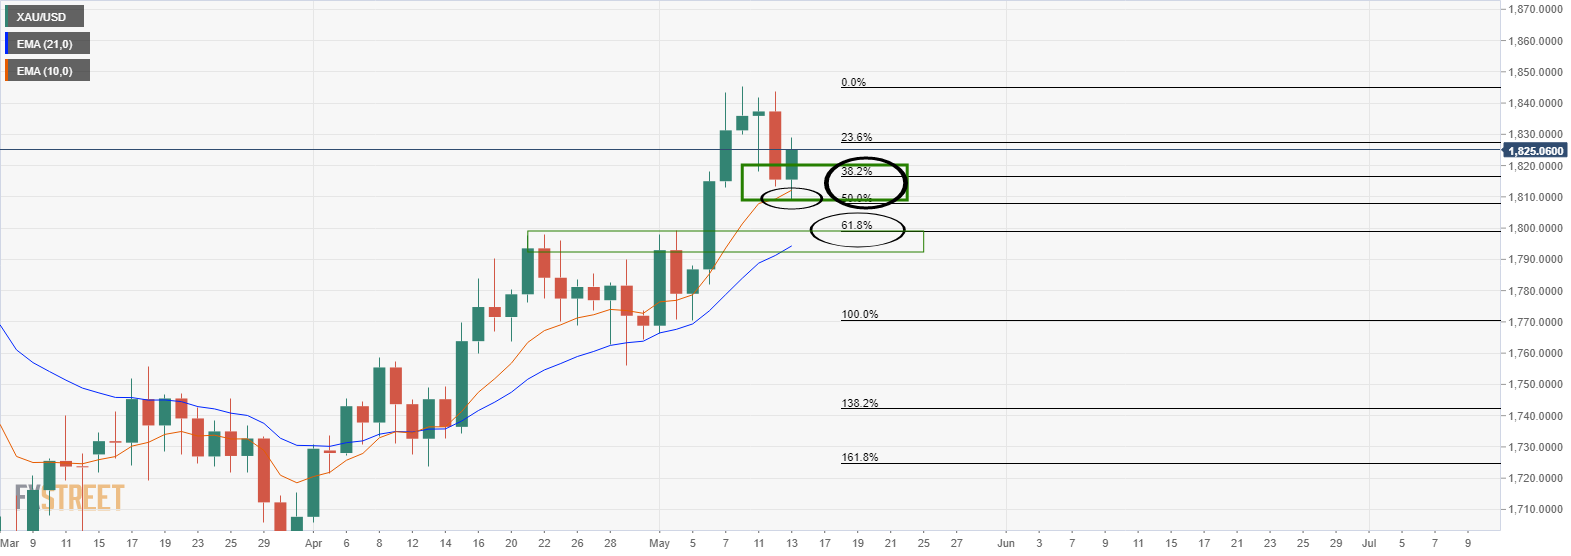
We have already seen the 50% mean reversion at 1,808, today's lows.
A deeper move and a break below the 10-day EMA opens a risk of a test of the next confluence zone in the 61.8% Fibonacci retracement that comes in at 1,800 and aligns with the 22nd April highs as the support structure.
On the hourly chart, this will involve a break of two critical supports and will drag the bulls and bears into a barroom brawl scenario.
Bears will want to avoid such a trap and hope for a discount if the price breaks below 1,815, fading the correction of the break:

As can be seen, there is a void of liquidity below the second support structure which bears will wish to exploit on a break of the structure.
Lower time frames, such as the 15 or 5-min charts, offer a vantage point in such scenarios where the price action can be fast, looking for smaller price change increments and bearish structure for an optimal entry point.
Author

Ross J Burland
FXStreet
Ross J Burland, born in England, UK, is a sportsman at heart. He played Rugby and Judo for his county, Kent and the South East of England Rugby team.


