Gold Price Analysis: XAU/USD remains trapped between 50 and 200-DMA ahead of US data


  • Gold awaits US data for a clear direction
  • 50-DMA caps the upside, 200-DMA offers strong support.
  • Daily RSI trades flat but in the bearish region.

Gold (XAU/USD) trades on the front foot this Friday amid dovish comments from the Fed Chief Powell.

However, gold’s further upside remains elusive, as the safe-haven demand for the US dollar is on the rise, with markets uncertain about the details of President-elect Joe Biden’s $1.9 stimulus package unveiled earlier in the Asian session.

Investors also turn cautious ahead of the critical US Retail Sales, especially after Thursday’s disappointing weekly Jobless Claims.

At the time of writing, gold trades at $1852.40, up 0.29% on the day, having found dip-demand at lower levels earlier this week.

Gold Price Chart: Daily

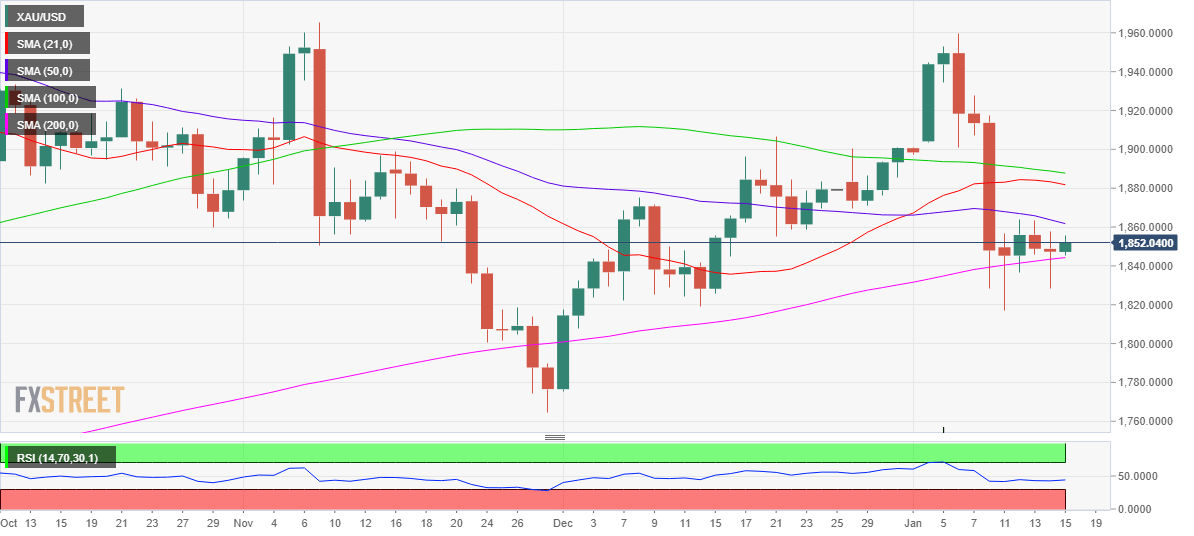
As observed in the daily chart, gold remains locked in a familiar range so far this week, with the upside attempts capped by the bearish 50-daily moving average (DMA), now at $1862.

Meanwhile, the upward-sloping 200-DMA at $1844 keeps the buyers hopeful. However, a sense of caution prevails, as the 14-day Relative Strength Index (RSI) still trends in the bearish region, now at 44.18.

The next relevant support is seen at Thursday’s low of $1829, below which the January 11 low of $1817 could be challenged.

Alternatively, acceptance above the 50-DMA hurdle could open doors for a test of the 21-DMA at $1882. Further up, the 100-DMA at $1888 would be on the buyers’ radars.

Gold Additional levels

XAU/USD

Overview
Today last price 1852.40
Today Daily Change 5.70
Today Daily Change % 0.31
Today daily open 1847.32
 
Trends
Daily SMA20 1883.27
Daily SMA50 1863.76
Daily SMA100 1888.86
Daily SMA200 1843.43
 
Levels
Previous Daily High 1857.6
Previous Daily Low 1828.54
Previous Weekly High 1959.42
Previous Weekly Low 1828.27
Previous Monthly High 1906.87
Previous Monthly Low 1775.52
Daily Fibonacci 38.2% 1839.64
Daily Fibonacci 61.8% 1846.5
Daily Pivot Point S1 1831.37
Daily Pivot Point S2 1815.43
Daily Pivot Point S3 1802.31
Daily Pivot Point R1 1860.43
Daily Pivot Point R2 1873.55
Daily Pivot Point R3 1889.49


Share: Feed news

Information on these pages contains forward-looking statements that involve risks and uncertainties. Markets and instruments profiled on this page are for informational purposes only and should not in any way come across as a recommendation to buy or sell in these assets. You should do your own thorough research before making any investment decisions. FXStreet does not in any way guarantee that this information is free from mistakes, errors, or material misstatements. It also does not guarantee that this information is of a timely nature. Investing in Open Markets involves a great deal of risk, including the loss of all or a portion of your investment, as well as emotional distress. All risks, losses and costs associated with investing, including total loss of principal, are your responsibility. The views and opinions expressed in this article are those of the authors and do not necessarily reflect the official policy or position of FXStreet nor its advertisers. The author will not be held responsible for information that is found at the end of links posted on this page.

If not otherwise explicitly mentioned in the body of the article, at the time of writing, the author has no position in any stock mentioned in this article and no business relationship with any company mentioned. The author has not received compensation for writing this article, other than from FXStreet.

FXStreet and the author do not provide personalized recommendations. The author makes no representations as to the accuracy, completeness, or suitability of this information. FXStreet and the author will not be liable for any errors, omissions or any losses, injuries or damages arising from this information and its display or use. Errors and omissions excepted.

The author and FXStreet are not registered investment advisors and nothing in this article is intended to be investment advice.

Recommended content


Recommended content

Editors’ Picks

EUR/USD edges lower toward 1.0700 post-US PCE

EUR/USD edges lower toward 1.0700 post-US PCE

EUR/USD stays under modest bearish pressure but manages to hold above 1.0700 in the American session on Friday. The US Dollar (USD) gathers strength against its rivals after the stronger-than-forecast PCE inflation data, not allowing the pair to gain traction.

EUR/USD News

GBP/USD retreats to 1.2500 on renewed USD strength

GBP/USD retreats to 1.2500 on renewed USD strength

GBP/USD lost its traction and turned negative on the day near 1.2500. Following the stronger-than-expected PCE inflation readings from the US, the USD stays resilient and makes it difficult for the pair to gather recovery momentum.

GBP/USD News

Gold struggles to hold above $2,350 following US inflation

Gold struggles to hold above $2,350 following US inflation

Gold turned south and declined toward $2,340, erasing a large portion of its daily gains, as the USD benefited from PCE inflation data. The benchmark 10-year US yield, however, stays in negative territory and helps XAU/USD limit its losses. 

Gold News

Bitcoin Weekly Forecast: BTC’s next breakout could propel it to $80,000 Premium

Bitcoin Weekly Forecast: BTC’s next breakout could propel it to $80,000

Bitcoin’s recent price consolidation could be nearing its end as technical indicators and on-chain metrics suggest a potential upward breakout. However, this move would not be straightforward and could punish impatient investors. 

Read more

Week ahead – Hawkish risk as Fed and NFP on tap, Eurozone data eyed too

Week ahead – Hawkish risk as Fed and NFP on tap, Eurozone data eyed too

Fed meets on Wednesday as US inflation stays elevated. Will Friday’s jobs report bring relief or more angst for the markets? Eurozone flash GDP and CPI numbers in focus for the Euro.

Read more

Forex MAJORS

Cryptocurrencies

Signatures