Gold Price Analysis: XAU/USD nears falling wedge hurdle
- Gold trades near $1,841 versus $1,829 in early Asia.
- A potential falling wedge breakout would imply bullish reversal.

Gold trades 0.6% higher on the day near $1,841 at press time.
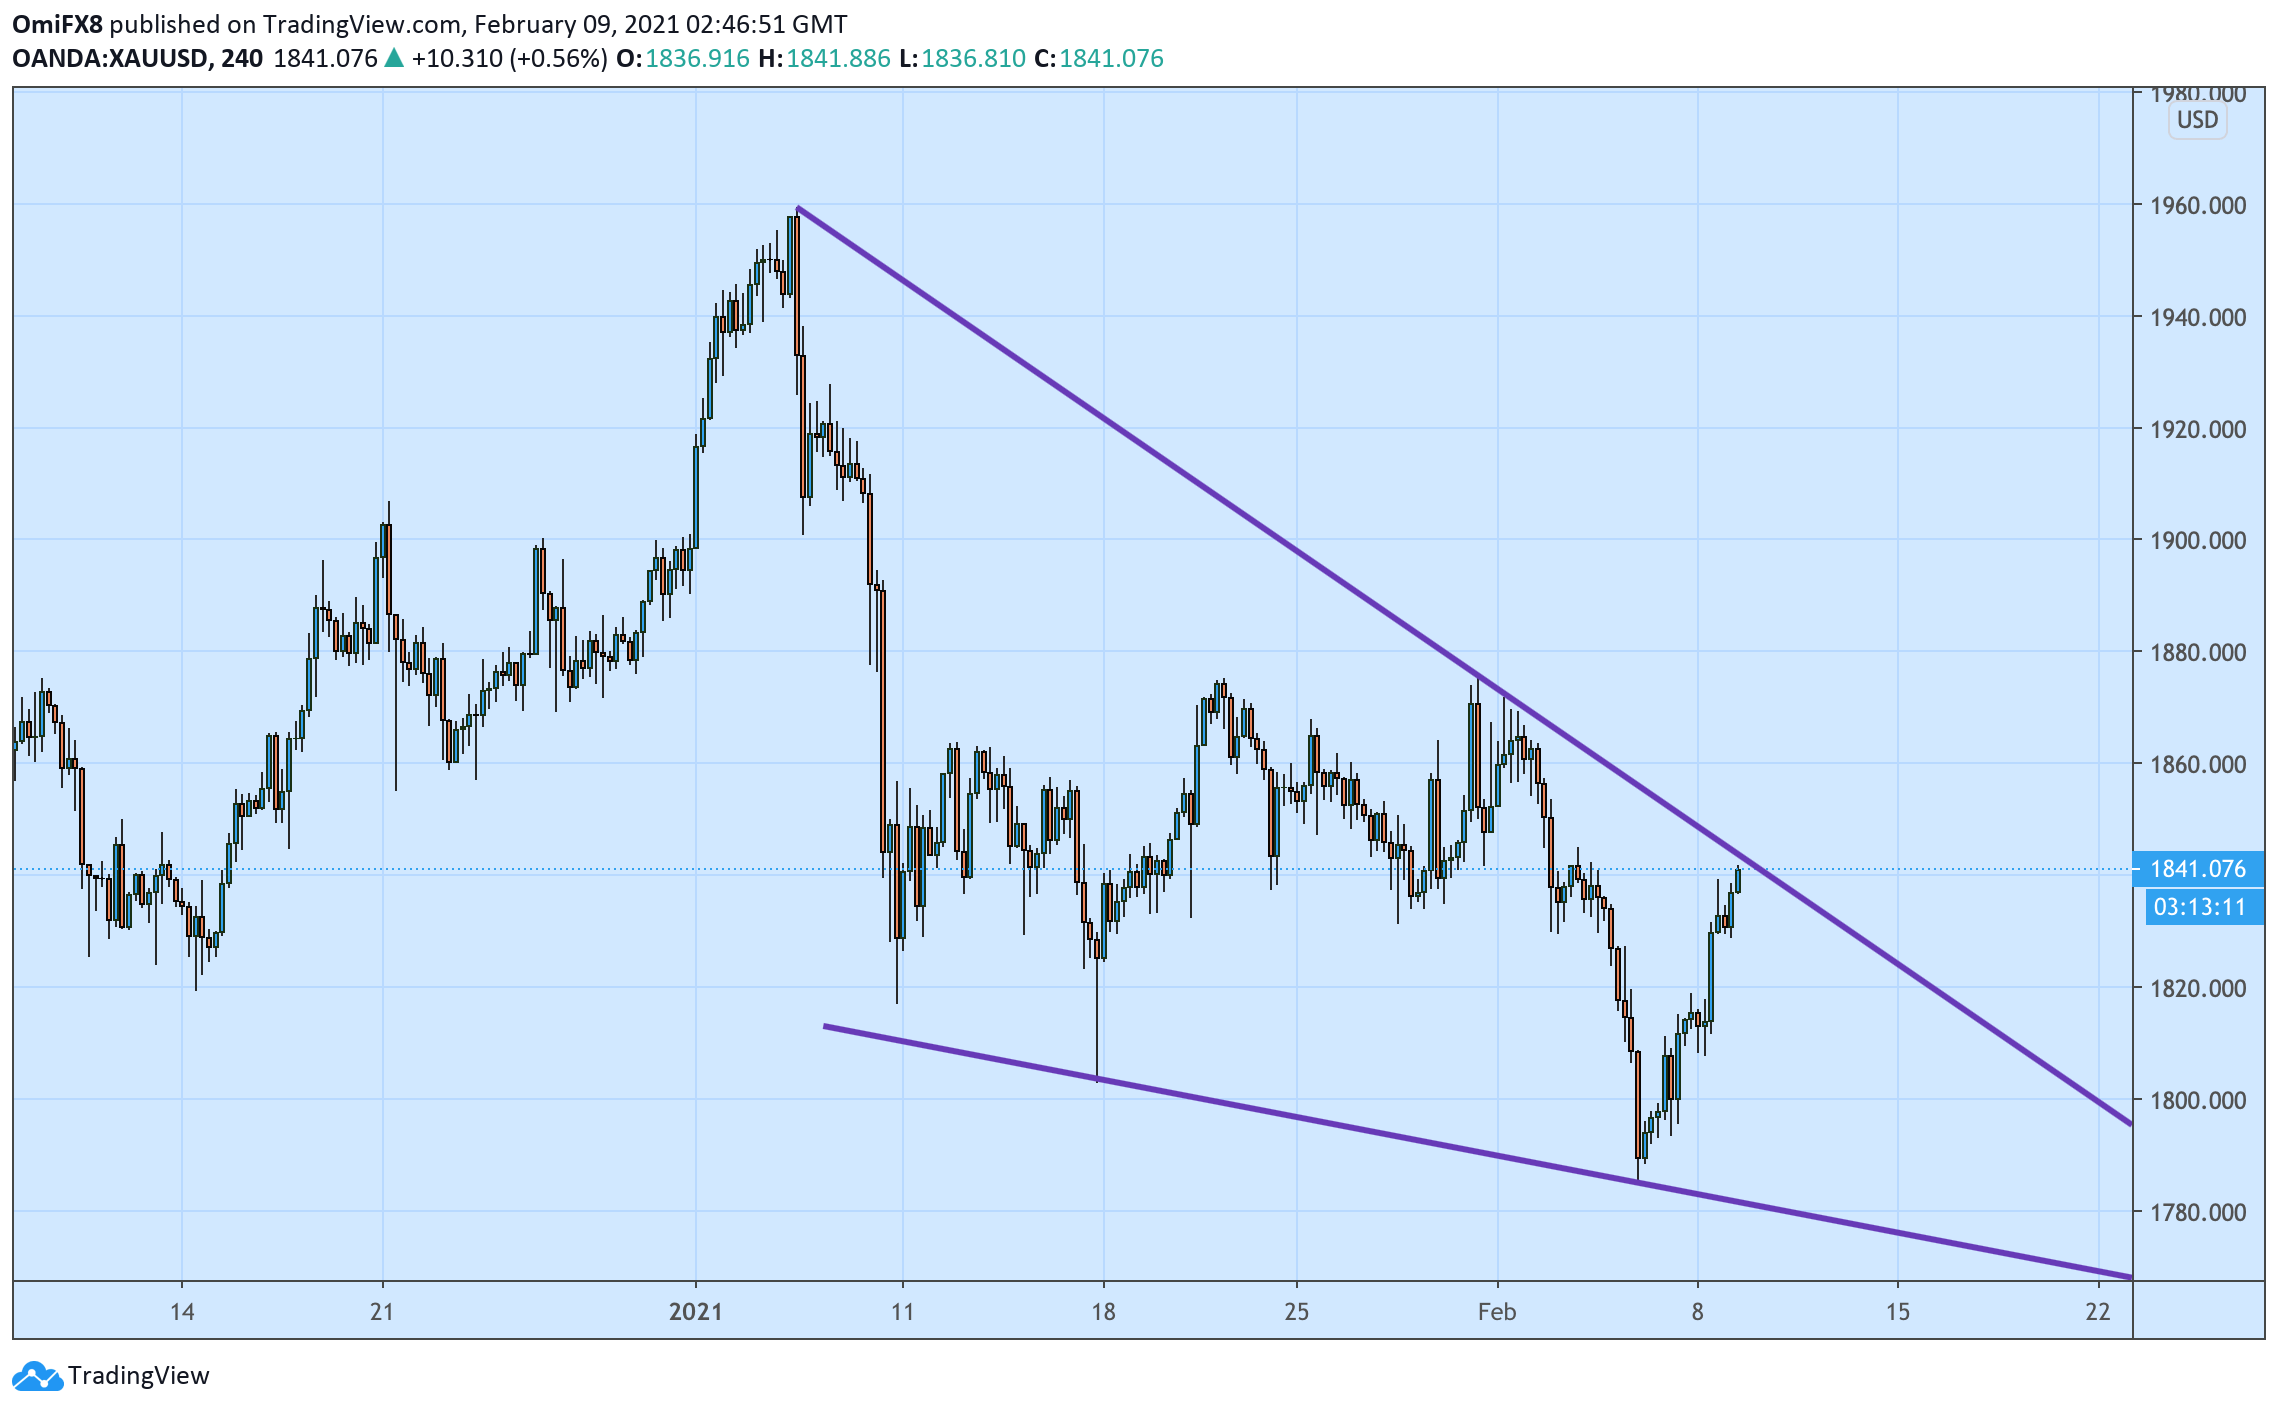
The 4-hour chart shows a falling wedge pattern – converging trendlines connecting lower highs and lower lows. The converging nature of trendlines indicates the weakening of the bearish momentum. As such, a breakout is considered bullish.
The wedge hurdle is currently seen at $1,844. Acceptance above that level would confirm an end of the pullback from the Jan. 6 high of $1,959 and reversal higher. The immediate resistance is located at $1,875 – the lower high created on Jan. 29.
On the downside, $1,820 is critical support followed by the recent low of $1,785.
4-hour chart
Trend: Bullish
Technical levels
Author

Omkar Godbole
FXStreet Contributor
Omkar Godbole, editor and analyst, joined FXStreet after four years as a research analyst at several Indian brokerage companies.


