Gold Price Analysis: XAU/USD 4-hour support is a hurdle for the bears

Update: The price of gold is trading at $1,836.81 at the time of writing and is up on the day by some 0.30%. The bulls, however, are backing off on what could be profit-taking as the US dollar stabilises within a narrow range on Monday vs a basket of major currencies. DXY is flat and has stuck to a 90.0420/3390 window.
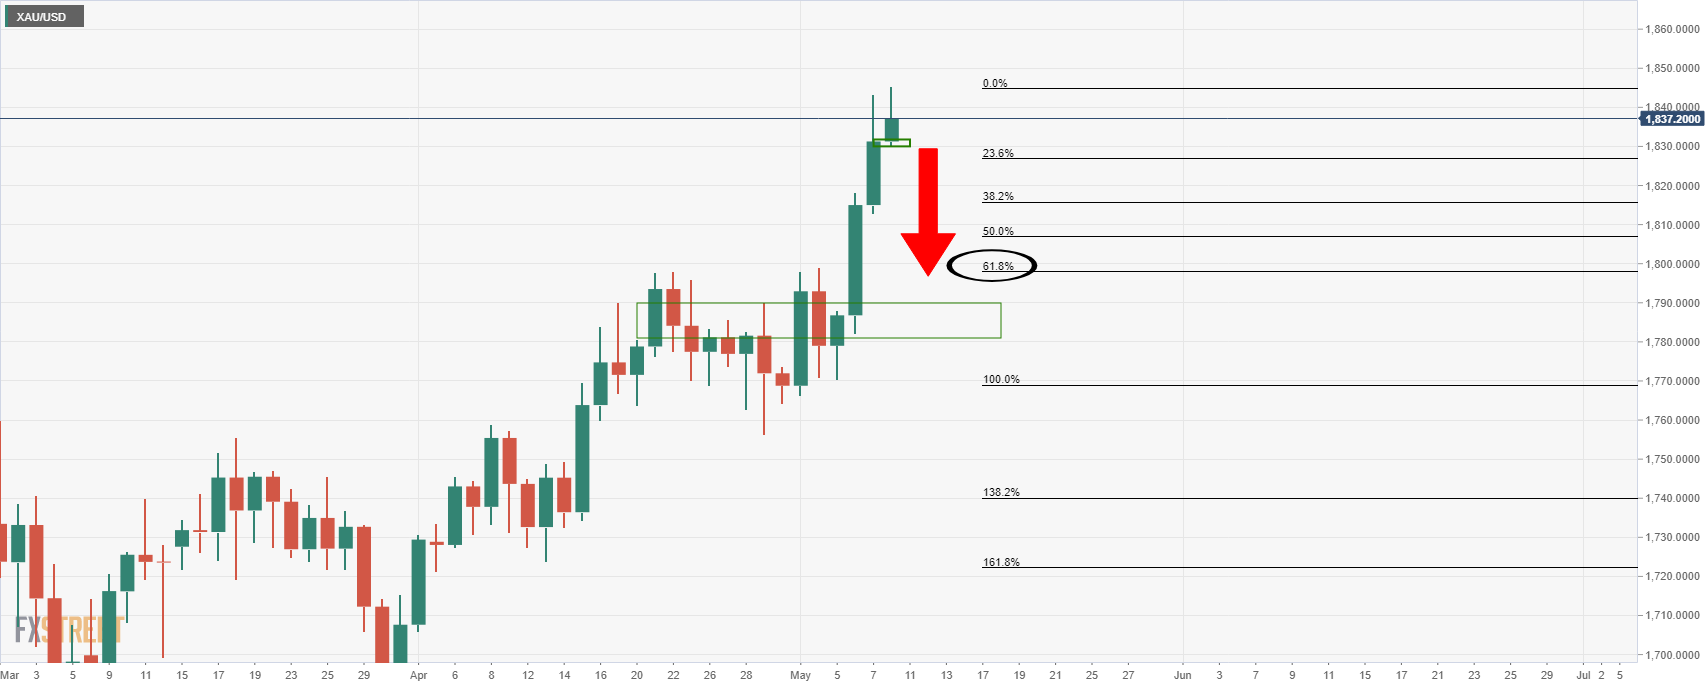
Meanwhile, from a technical standpoint, due to the sheer size of the rally and while many might presume that a deeper correction of the daily bullish impulse is a forgone conclusion, there is a significant support area on the 4-hour chart that would need to break first.
Daily chart
4-hour chart
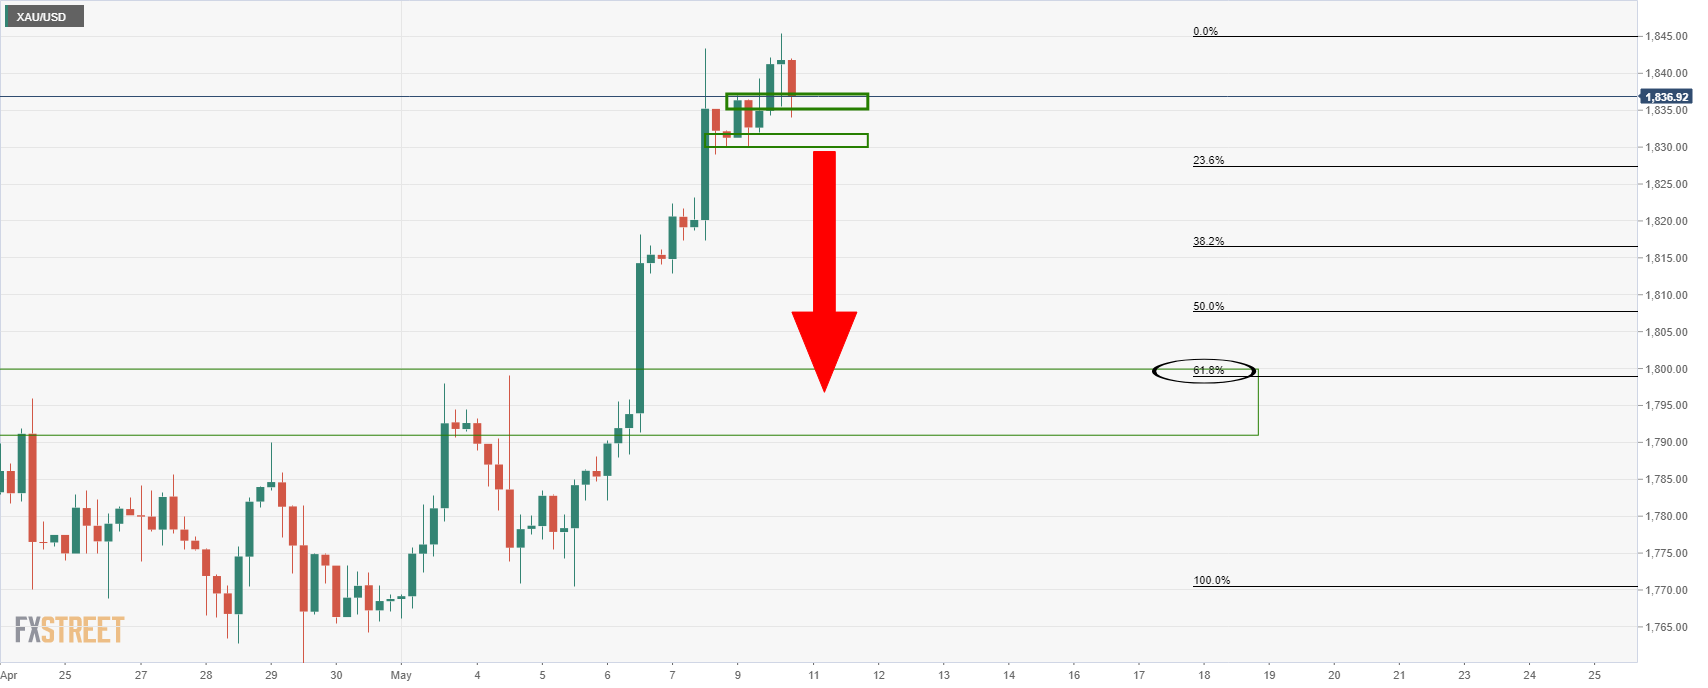
While the confluence of the 61.8% Fibonacci retracement and prior daily highs is compelling, the 4-hour chart's support structure is double layered which could be problematic for the bears for the forthcoming sessions.
End of update
Gold is rising for the fourth straight day on Monday. The next hurdle for XAU/USD is located around $1,850 but overbought conditions may trigger a corrective decline, FXStreet’s Eren Sengezer briefs.
See – Gold Price Analysis: XAU/USD bulls come out of the shadows to mull a test of $1850 – DBS Bank
XAU/USD eyes critical resistance at $1,850
“The negative impact of the disappointing US labour market data is still being felt in the markets on Monday with the US Dollar Index slumping to its lowest level since late February near 90.00. Moreover, the benchmark 10-year US T-bond yield stays in the negative territory at 1.579% at the time of press, helping gold continue to find demand.”
“On the daily chart, the Relative Strength Index (RSI) indicator stays near 70. The last time RSI rose above that level back in early January, XAU/USD staged a deep correction and lost more than 5% in less than a week. Although the yellow metal is unlikely to make a similar correction in the current fundamental setup, it could still retreat before the next leg up.”
“On the downside, $1,820 (Fibonacci 50% retracement of the January-March downtrend) could be seen as the first support level ahead of $1,800 (psychological level, 100-day SMA). Only a daily close above the latter could discourage buyers and eliminate the near-term bullish outlook.”
“The initial target is located at $1,850, where the Fibonacci 61.8% retracement level meets the 200-day SMA. If gold manages to rise above that hurdle and turn it into support, it could aim for $1,860 (static level).”
Author
FXStreet Insights Team
FXStreet
The FXStreet Insights Team is a group of journalists that handpicks selected market observations published by renowned experts. The content includes notes by commercial as well as additional insights by internal and external analysts.


