Gold Price Analysis: XAU/USD looks north amid US political woes, Georgia’s Blue sweep – Confluence Detector


Gold (XAU/USD) attempts a bounce after Wednesday’s 2% slide, fuelled by the rally in US Treasury yields and stocks. Prospects of additional US stimulus amid a likely Blue sweep in the Senate revived the reflationary trades and drove the US rates sharply higher while Wall Street to fresh record highs.

Despite the sell-off in gold, the risks remain tilted to the upside amid expectations of more stimulus and growing US political tensions after the attack on Capitol Hill late Wednesday.

How is gold positioned technically?

Gold Price Chart: Key resistances and supports

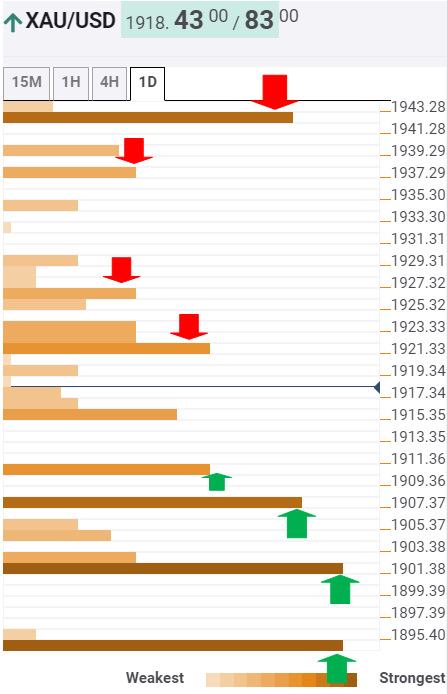
The Technical Confluences Indicator shows that gold lacks healthy resistance levels, making it an easy path for the bulls to extend the recovery momentum.

$1923 is the next relevant upside cap, which is the confluence of the pivot point one-week R2 and SMA5 one-day.

The gold buyers will then look to clear the $1926 (SMA100 one-hour) resistance on its journey towards $1937, which is the Fibonacci 61.8% one-day.

Further north, the intersection of the pivot point one-week R3 and Bollinger Band one-day Upper at 1942 could likely offer strong resistance.

Alternatively, immediate support is seen at $1915, which the Fibonacci 23.6% one-day. A break below which the sellers could probe the pivot point one-week R1 at $1910.

The previous month high at $1908 could challenge the bears’ commitment, as the next powerful support awaits at $1902, the confluence of the previous week high and the previous day low.

The convergence of the Fibonacci 23.6% one-week and SMA100 one-day at $1895 is the last resort for the XAU bulls.

Here is how it looks on the tool

fxsoriginal

About Confluence Detector

The TCI (Technical Confluences Indicator) is a tool to locate and point out those price levels where there is a congestion of indicators, moving averages, Fibonacci levels, Pivot Points, etc. Knowing where these congestion points are located is very useful for the trader, and can be used as a basis for different strategies.

Learn more about Technical   Confluence

Share: Feed news

Information on these pages contains forward-looking statements that involve risks and uncertainties. Markets and instruments profiled on this page are for informational purposes only and should not in any way come across as a recommendation to buy or sell in these assets. You should do your own thorough research before making any investment decisions. FXStreet does not in any way guarantee that this information is free from mistakes, errors, or material misstatements. It also does not guarantee that this information is of a timely nature. Investing in Open Markets involves a great deal of risk, including the loss of all or a portion of your investment, as well as emotional distress. All risks, losses and costs associated with investing, including total loss of principal, are your responsibility. The views and opinions expressed in this article are those of the authors and do not necessarily reflect the official policy or position of FXStreet nor its advertisers. The author will not be held responsible for information that is found at the end of links posted on this page.

If not otherwise explicitly mentioned in the body of the article, at the time of writing, the author has no position in any stock mentioned in this article and no business relationship with any company mentioned. The author has not received compensation for writing this article, other than from FXStreet.

FXStreet and the author do not provide personalized recommendations. The author makes no representations as to the accuracy, completeness, or suitability of this information. FXStreet and the author will not be liable for any errors, omissions or any losses, injuries or damages arising from this information and its display or use. Errors and omissions excepted.

The author and FXStreet are not registered investment advisors and nothing in this article is intended to be investment advice.

Recommended content


Recommended content

Editors’ Picks

EUR/USD retreats toward 1.0850 on modest USD recovery

EUR/USD retreats toward 1.0850 on modest USD recovery

EUR/USD stays under modest bearish pressure and trades in negative territory at around 1.0850 after closing modestly lower on Thursday. In the absence of macroeconomic data releases, investors will continue to pay close attention to comments from Federal Reserve officials.

EUR/USD News

GBP/USD holds above 1.2650 following earlier decline

GBP/USD holds above 1.2650 following earlier decline

GBP/USD edges higher after falling to a daily low below 1.2650 in the European session on Friday. The US Dollar holds its ground following the selloff seen after April inflation data and makes it difficult for the pair to extend its rebound. Fed policymakers are scheduled to speak later in the day.

GBP/USD News

Gold climbs to multi-week highs above $2,400

Gold climbs to multi-week highs above $2,400

Gold gathered bullish momentum and touched its highest level in nearly a month above $2,400. Although the benchmark 10-year US yield holds steady at around 4.4%, the cautious market stance supports XAU/USD heading into the weekend.

Gold News

Chainlink social dominance hits six-month peak as LINK extends gains

Chainlink social dominance hits six-month peak as LINK extends gains

Chainlink (LINK) social dominance increased sharply on Friday, exceeding levels seen in the past six months, along with the token’s price rally that started on Wednesday. 

Read more

Week ahead: Flash PMIs, UK and Japan CPIs in focus – RBNZ to hold rates

Week ahead: Flash PMIs, UK and Japan CPIs in focus – RBNZ to hold rates

After cool US CPI, attention shifts to UK and Japanese inflation. Flash PMIs will be watched too amid signs of a rebound in Europe. Fed to stay in the spotlight as plethora of speakers, minutes on tap.

Read more

Forex MAJORS

Cryptocurrencies

Signatures